
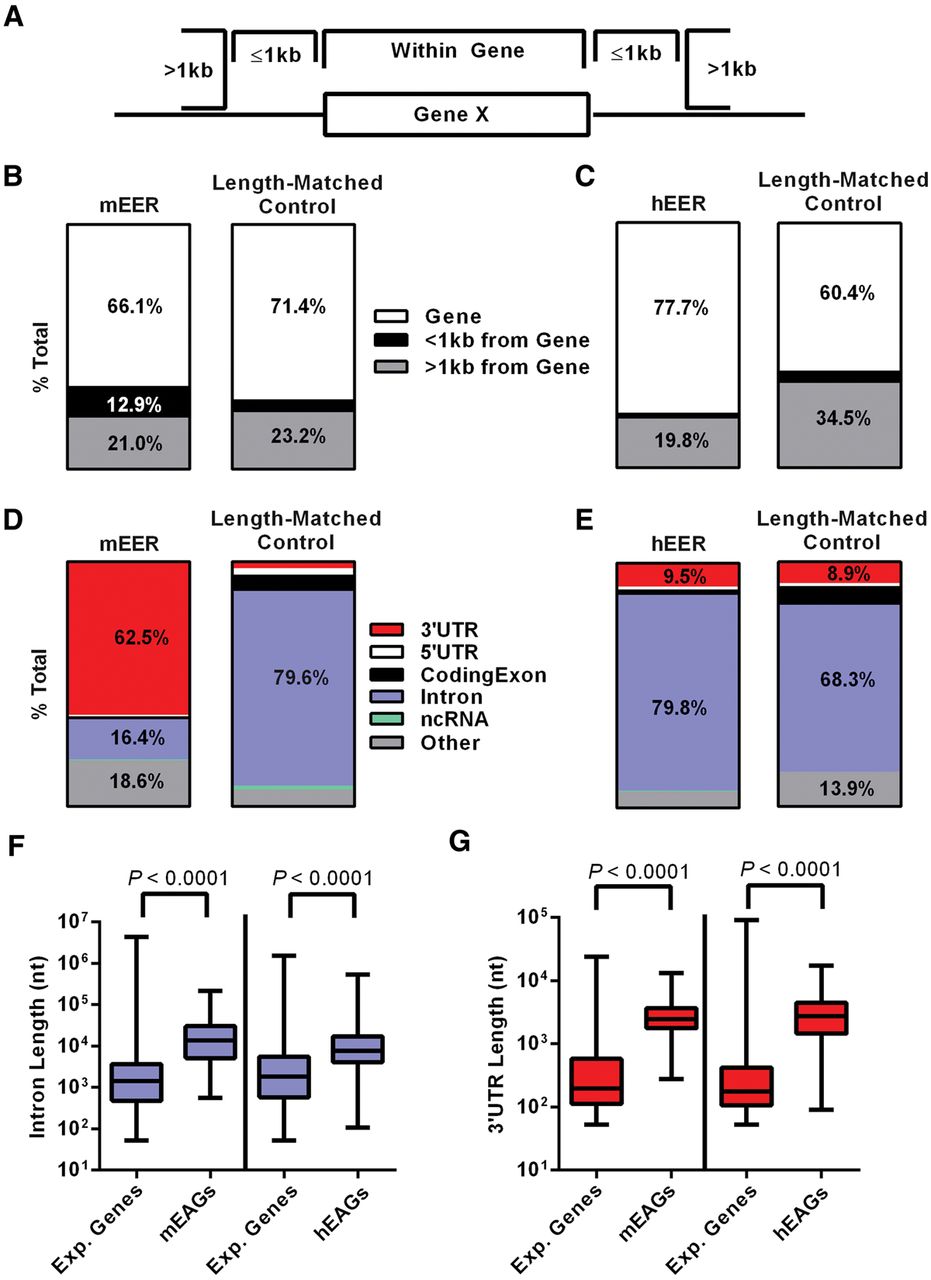
EERs are largely located in mouse 3′ UTRs and human introns. (A) Schematic of potential EER locations described in “parts of whole” bar plot for (B) mEERs and (C) hEERs, relative to length-matched controls. Location of EERs in a gene as 3′ UTR, 5′ UTR, coding exon, intron, ncRNA, or other feature (including unannotated space) for (D) mEERs and (E) hEERs, compared to length-matched controls. Overlap is reported as the percentage of EER bases overlapping an annotation, and plots indicate all categories >8% with text labels. (F) Length of introns containing EERs for mEAGs and hEAGs relative to introns in all expressed genes (Exp. Genes) in our analysis >53 nt (smallest EER) for each data set. (G) Length of 3′ UTRs containing EERs for mEAGs and hEAGs relative to 3′ UTRs in all expressed genes (Exp. Genes) in our analysis >53 nt (smallest EER) for each data set. P-values determined by Mann-Whitney U test.


