
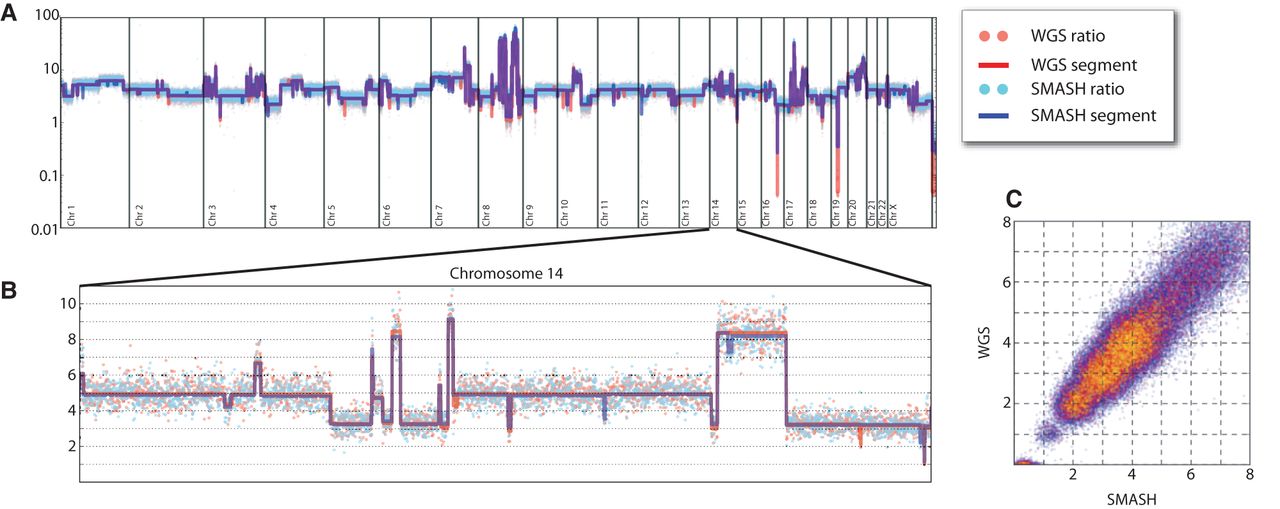
SMASH and WGS copy number profiles for SKBR3. (A) The complex copy number pattern within the SKBR3 cell line is shown in whole-genome view. Copy number is indicated on a log scale. The red and blue dots show the GC-normalized ratio values for WGS and SMASH, respectively, while the red and blue lines show the copy number segmentation. (B) Chromosome 14 is shown in an expanded view with a linear scale. There is strong agreement between WGS and SMASH in the integer copy number state segmentations and dispersion about the segment mean. (C) A bin-for-bin comparison of the normalized ratio values from WGS (y-axis) and SMASH (x-axis) is displayed as a scatter plot. The red and yellow points show increasingly sparse subsamples of the data points to illustrate density.


