
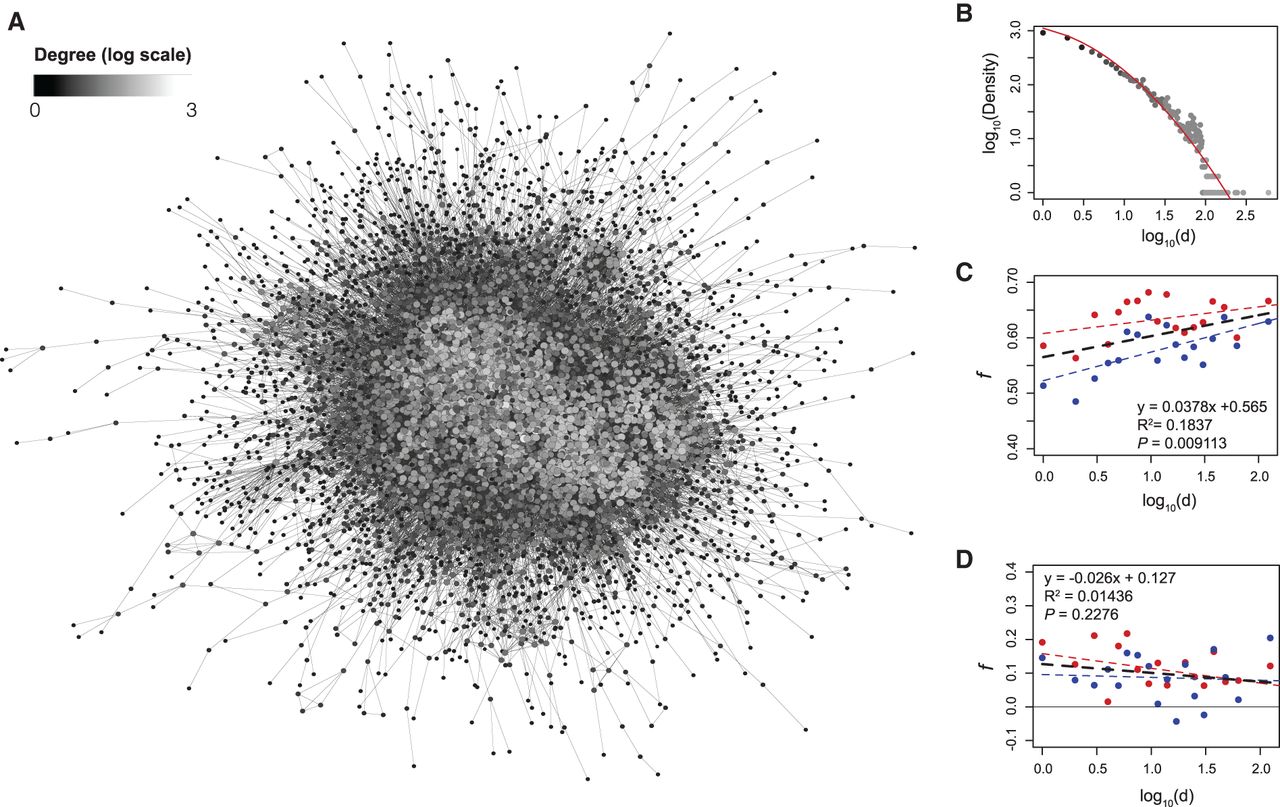
Higher burden of nonsynonymous SNVs for proteins at the center versus periphery of protein–protein interaction networks. (A) PPI network of 6700 protein-coding genes with 56,728 significant connections (STRING score >0.7). Each protein is a node and is shaded by the number of interactions (degree). (B) Relationship between the average number of interacting proteins (x-axis) and the degree of connectivity (y-axis) for the PPI network. (C) Relationship between the average number of interacting protein neighbors on estimates of f at nonsynonymous SNVs, showing significantly increased purifying selection on genes located at center rather than periphery of the PPI network. (D) No significant relationship between the average number of interacting proteins on estimates of f at synonymous sites.


