
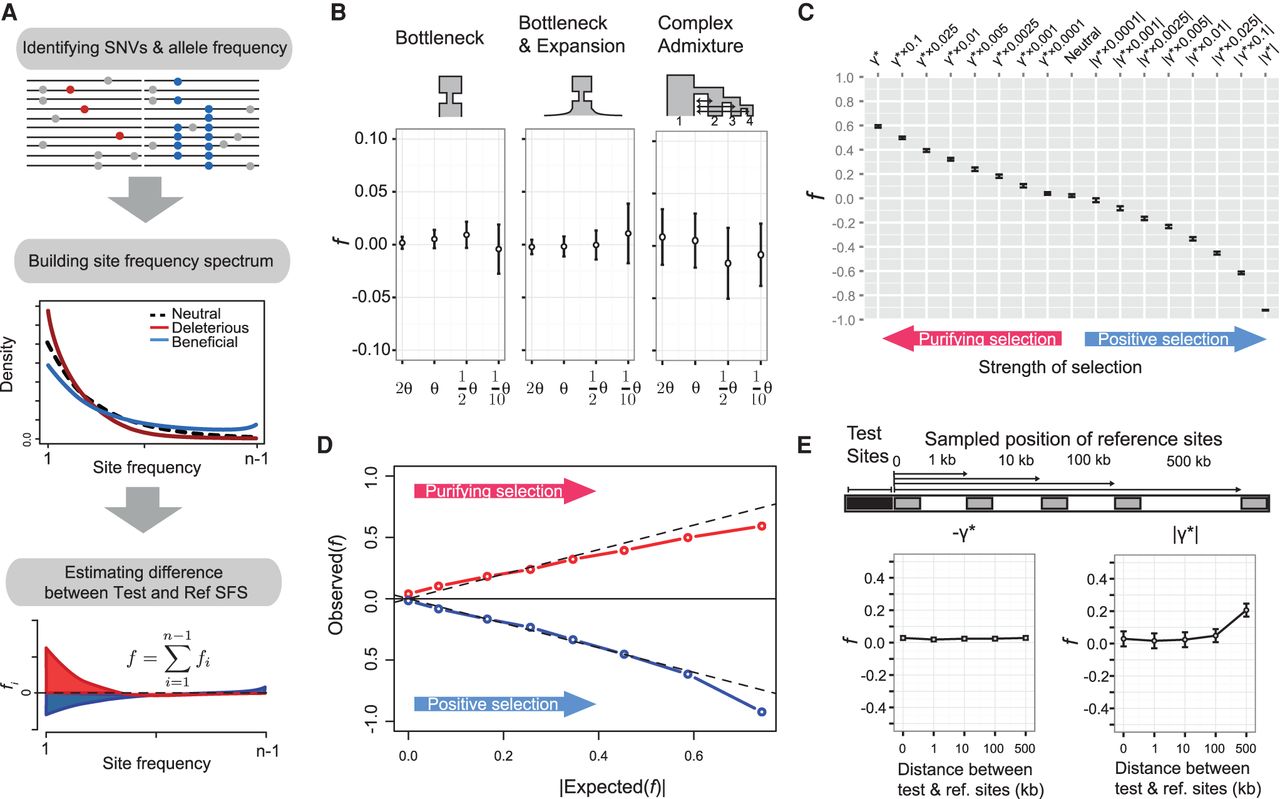
A nonparametric approach for estimating the fraction of SNVs under selection. (A) Schematic illustration of the method to estimate f by comparing a test SFS to a putatively neutral reference SFS. The fraction of deleterious (red) and advantageous (blue) SNVs is estimated as the scaled difference between test and reference SFS (see Methods). (B) Estimates of f when test and reference sites have different mutation rates (the test SFS was set to θ) for a different demographic model. The estimate of f in the population structure model is from population one. (C) Estimates of f as a function of strength of selection assuming the same demographic model as in B. (γ*) Baseline selection model (Boyko et al. 2008). (D) Comparison between observed and expected estimates of f (|s| > 0.0001) inferred from the distribution of selection coefficients. (E) Estimates of f for neutral mutations linked to selected sites (black region) as a function of distance from reference sites (gray regions).


