
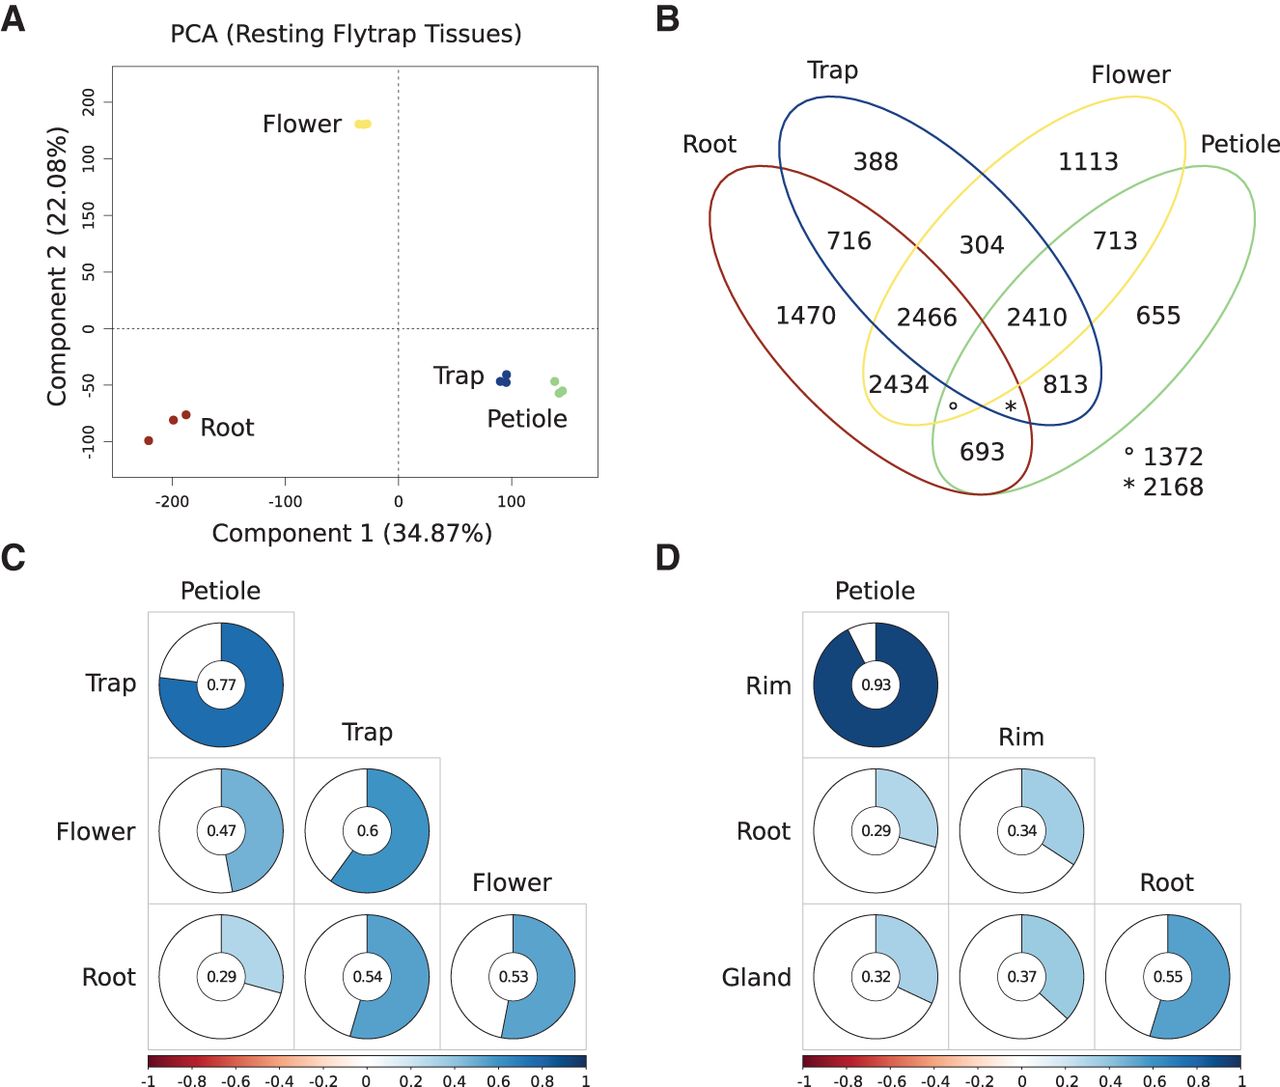
The transcriptomic landscape of the nonstimulated Venus flytrap (Dionaea muscipula). (A) Principal component analysis of all biological replicates (n = 3) from petiole, trap, root, and flower. The first two dimensions account for 57% of all the variance in the nonstimulated Venus flytrap data (for additional dimensions, see Supplemental Fig. S1). (B) Venn diagram from an all-versus-all differential expression analysis. Overall, 14,744 DEGs were shared by at least two tissues, while 3626 DEGs are most likely expressed in a tissue-specific manner. (C) Hierarchically clustered visualization of the global Pearson correlation between all major organs. All individual pairwise correlations are significant according to multiple testing adjusted probabilities (P ≤ 0.01). (D) Visualization of the global Pearson correlation between all major organs with traps being represented by rim and gland. Again all correlations tested are significant (P ≤ 0.01).


