
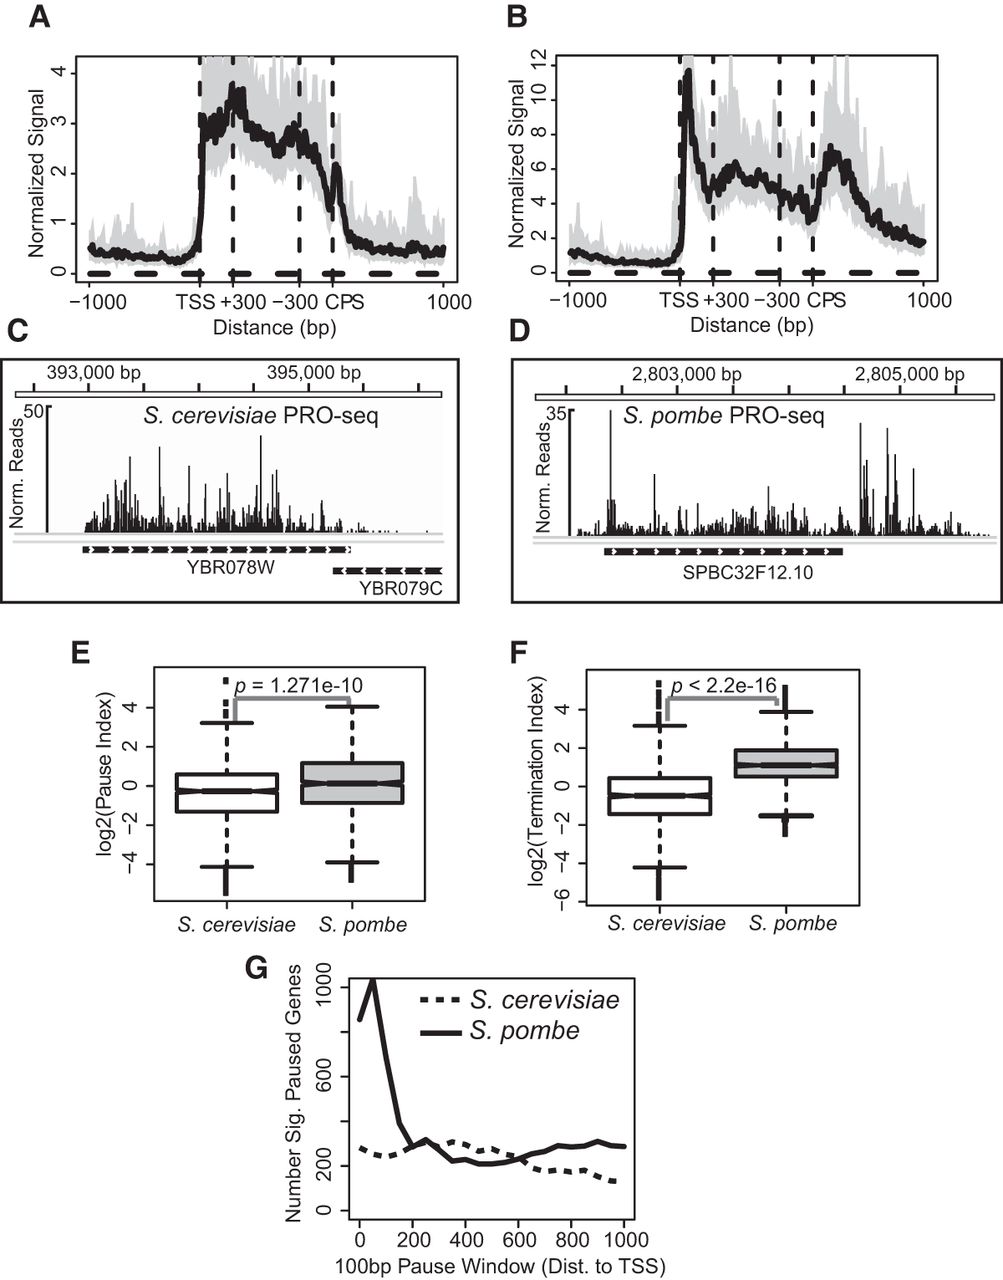
PRO-seq reveals distinct transcription elongation profiles in S. cerevisiae and S. pombe. (A,B) Median PRO-seq read count across all active and filtered genes in S. cerevisiae (A) or S. pombe (B) that are separated from neighboring genes on the strand by at least 1 kb (S. cerevisiae: n = 1101; S. pombe: n = 874). Bins between the +300 and −300 bp marks are scaled based on gene length, whereas upstream of and downstream from this center region, 10-bp bins were used. The shaded regions around the curves represent the 12.5% and 87.5% quantiles. (C,D) Representative genes from S. cerevisiae (C) and S. pombe (D) with PRO-seq read counts plotted above. (E,F) Box plots of pausing index (E) or termination index (F) values calculated for all genes that were included in A and B. P-values represent results of Student's t-test. (G) A test for enrichment of pausing near the promoter versus other gene regions. Reads were counted within a sliding 100-bp window from 0 to 1000 bp from the TSS of all filtered, active genes and divided by the counts within the remaining mappable gene length. Fisher's exact test was used to determine the number of significantly paused genes (adjusted P < 0.01).


