
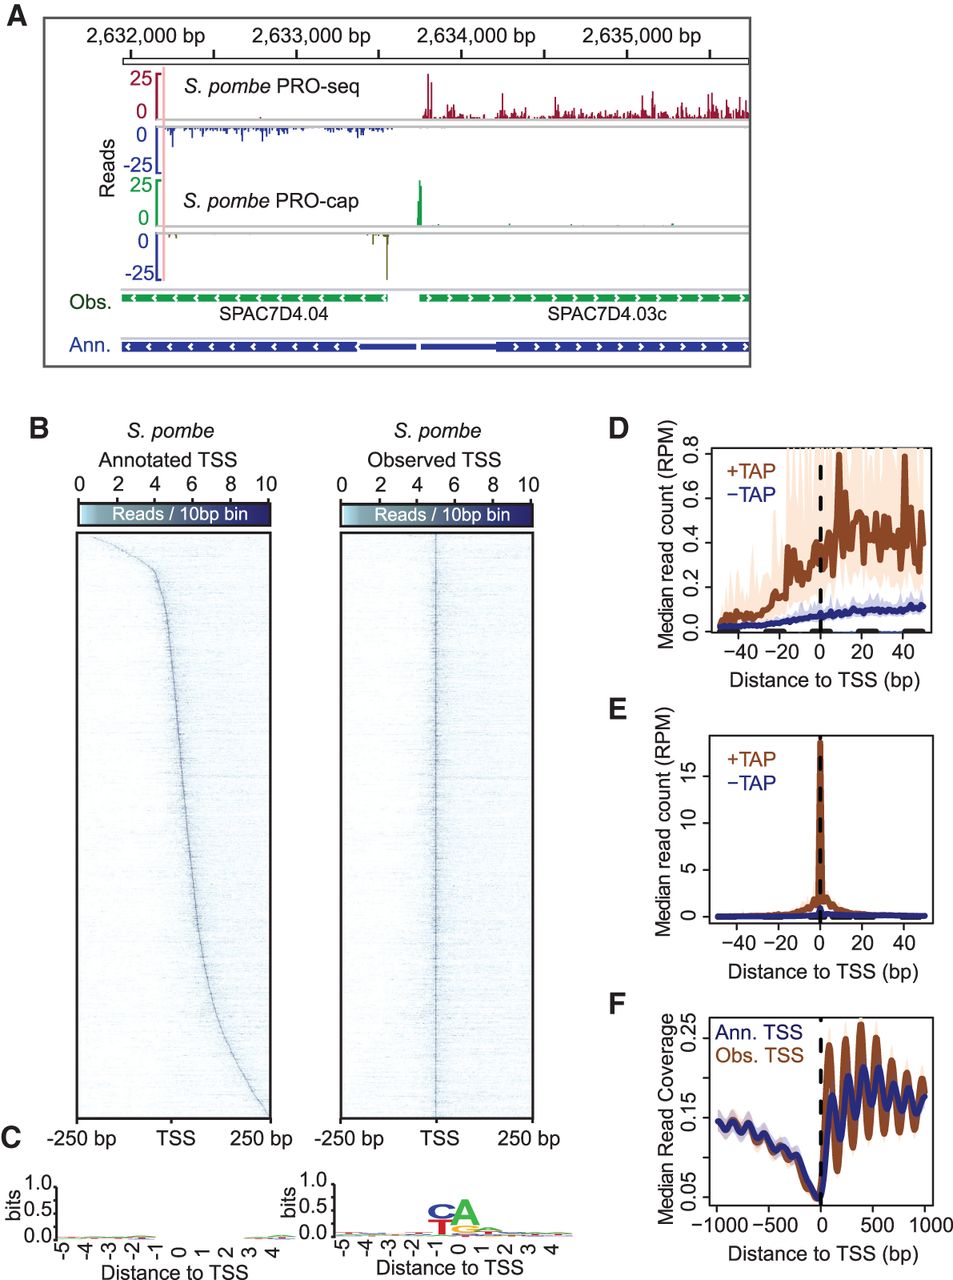
PRO-seq and PRO-cap capture transcription elongation and initiation genome-wide in S. pombe. (A) Browser tracks of PRO-seq (plus strand: red; minus strand: blue) and PRO-cap data (plus strand: green; minus strand: olive) derived from S. pombe. Green gene models below the data tracks show the reannotated, “observed” transcription start-sites based on PRO-cap data. Blue gene models correspond to the available annotations of genes. (B) Heatmaps of S. pombe PRO-cap signal for each base within ±250 bp around the annotated TSS (left) and PRO-cap observed TSS (right) for all active and filtered genes (n = 3214). Genes within heatmaps are sorted by increasing downstream distance of observed TSS relative to annotated TSS. (C) Sequence logos of 10-bp sequence centered on either annotated TSS (left) or observed TSS (right) generated using WebLogo (Crooks et al. 2004). (D) PRO-cap signal from samples prepared either with or without Tobacco Acid Pyrophosphatase (TAP) treatment centered on annotated TSS. The TAP-minus samples represent empirical levels of background for each genomic position. (E) Median PRO-cap signal from samples prepared either with or without TAP treatment centered on observed TSS. (F) Median MNase-seq coverage centered on annotated TSSs (blue) or observed TSSs (brown). For the metagene plots, the y-axis shows the median read counts for each base-pair (D,E), or median read coverage within 10-bp bins (F). In D, E, and F, the 12.5% and 87.5% quantiles are shown in lightly shaded regions.


