
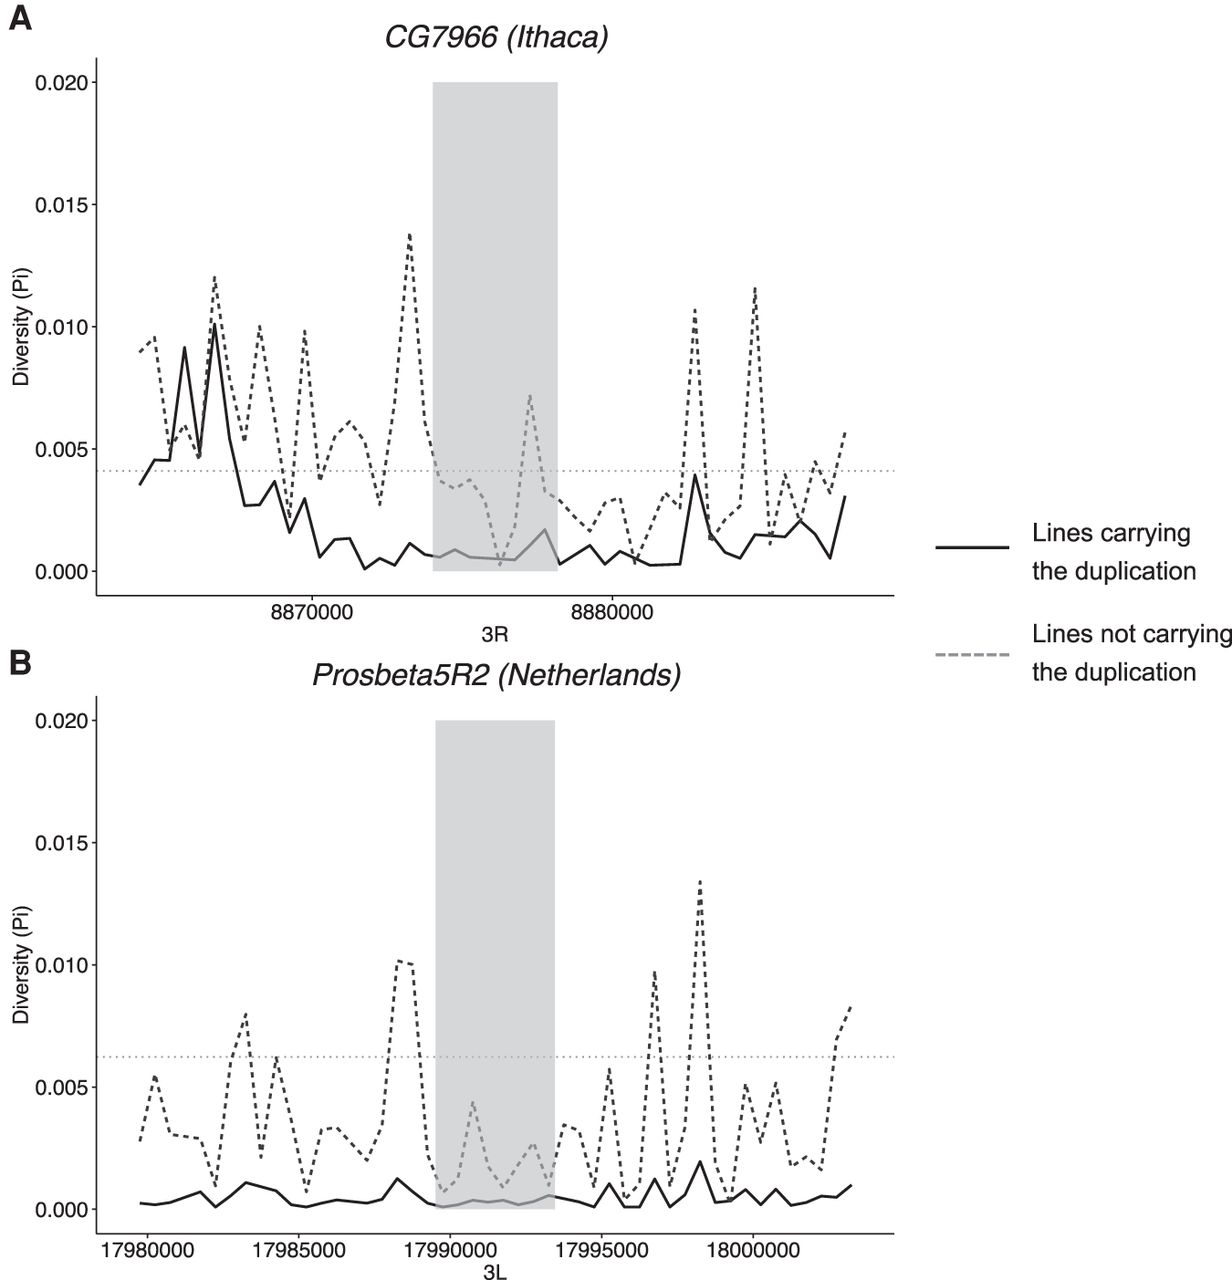
Reduced levels of nucleotide diversity flanking two gene duplications are suggestive of positive selection. (A) Comparison of diversity levels in lines carrying the CG7966 duplication (n = 7, solid line) and not carrying this gene duplication (n = 12, dashed line) in the Ithaca population. The gray box marks the limits of the duplication; and the dotted horizontal line, the median diversity levels for this chromosome in this population (data for the other populations in Supplemental Fig. 17). (B) Comparison of diversity levels in lines carrying the highest-frequency duplication of Prosbeta5R2 (n = 9, solid line) and not carrying this gene duplication (n = 10, dashed line) in the Netherlands population (data for the other populations in Supplemental Fig. 18).


