
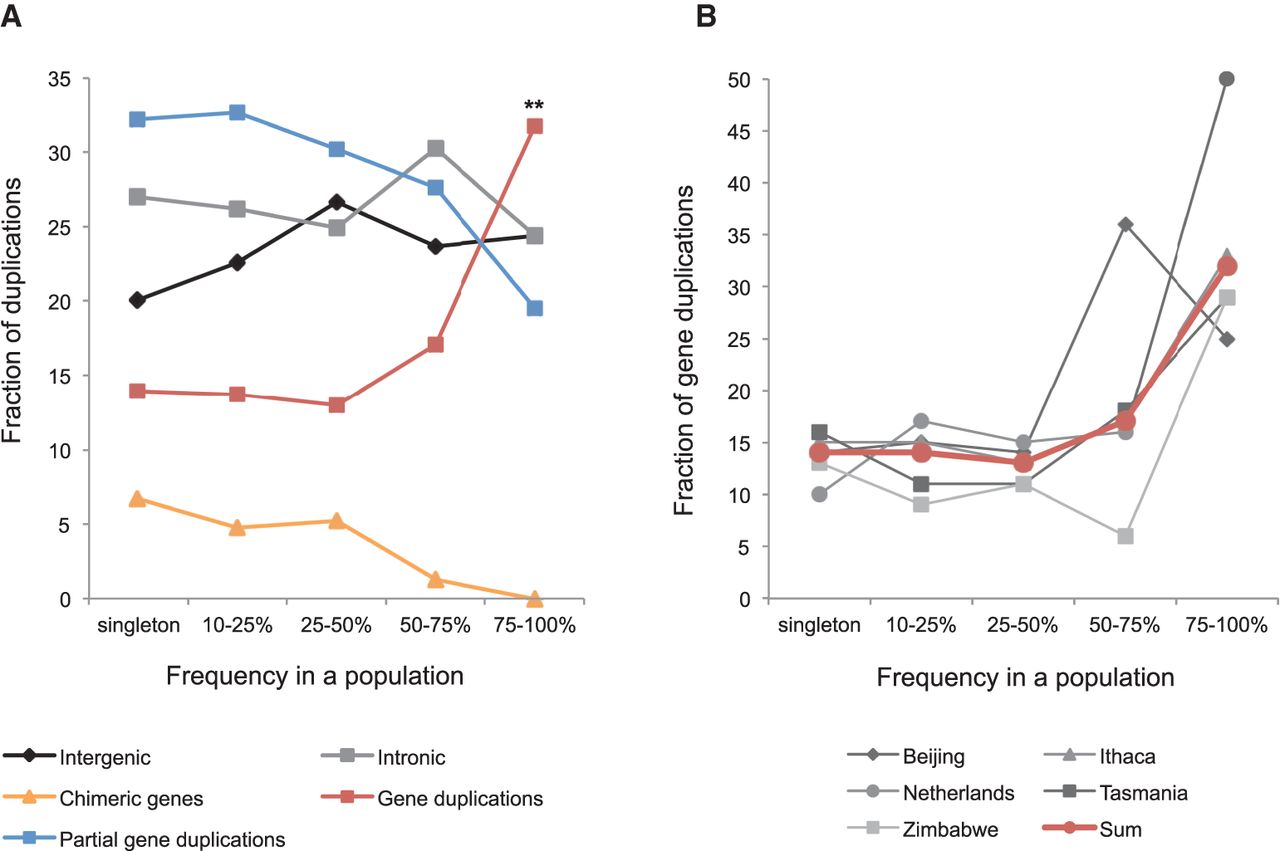
Gene duplications are significantly enriched among all high-frequency duplications. (A) For bins of increasing frequency, we plot the fraction of duplications (per bin) that overlap different genomic contexts. The data shown represent the combined data from the five populations for the subset of autosomal duplications. The asterisks indicate that gene duplications are significantly enriched among all duplications segregating in at least 75% of the lines (Fisher's exact test, P = 0.02 vs. all duplications, P = 0.03 vs. intronic/intergenic duplications). (B) Subset of A showing for the five populations (in gray) and for the combined data (in red) the fraction of duplications that corresponds to gene duplications across the different frequency bins.


