
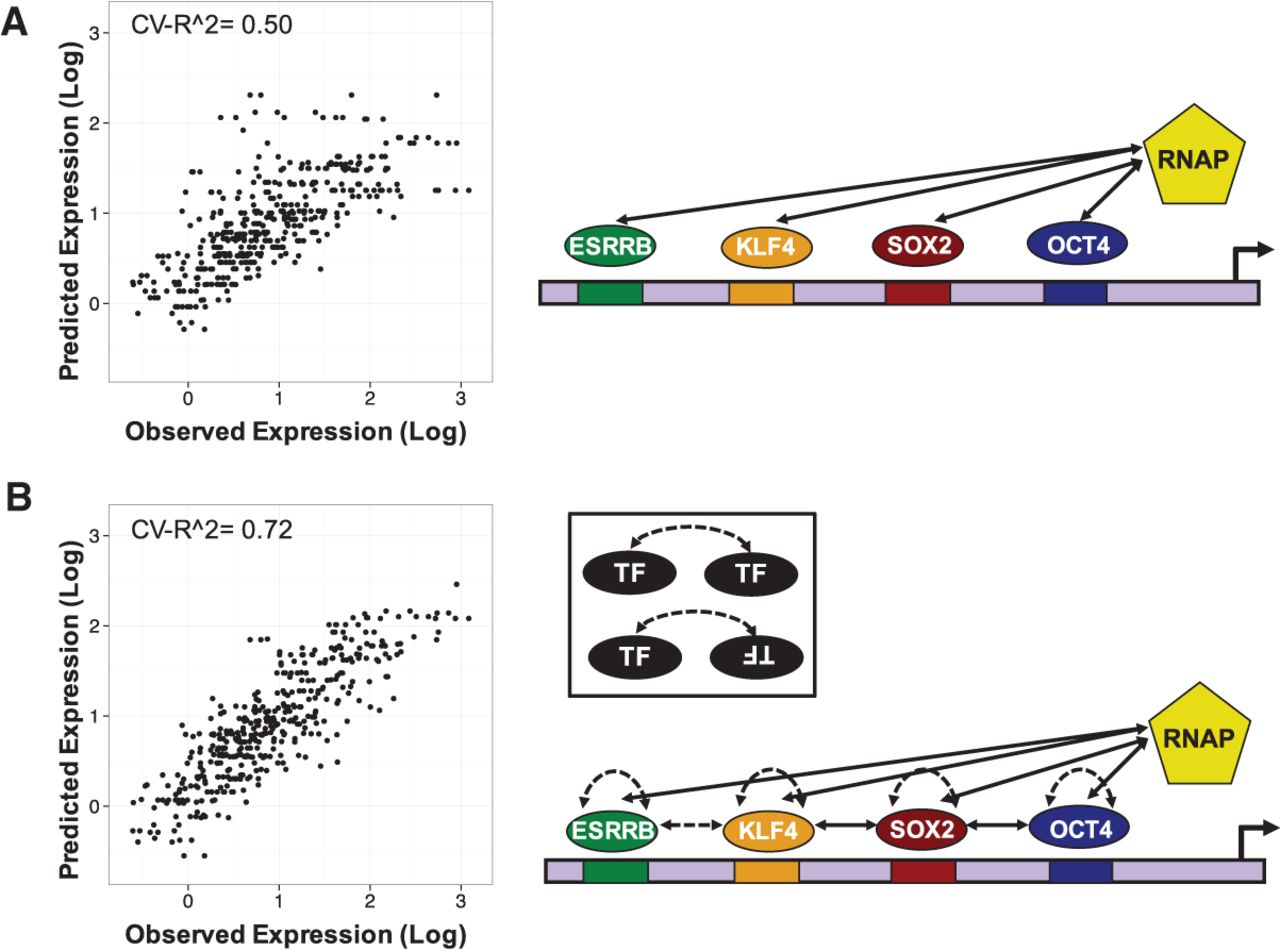
Thermodynamic model of OSKE library. In scatter plots, observed expression of each CRE from massively parallel reporter assays (Supplemental Fig. S1; Supplemental Data S1) is plotted on the x-axis, and the predicted expression of each CRE by the model is on the y-axis. In depictions of models, solid lines represent interactions following the “neighboring” rule, and dashed lines represent interactions following the “across” rule (Supplemental Fig. S2). See Table 1 for parameter values. (A) Model with only four TF–RNAP interaction parameters predicts expression with cross-validated R2 of 0.50. (B) Full model with five TF–TF interaction parameters in addition to four TF–RNAP interaction parameters predicts expression with cross-validated R2 of 0.72. Interactions were validated using genomic data (Supplemental Fig. S3).


