
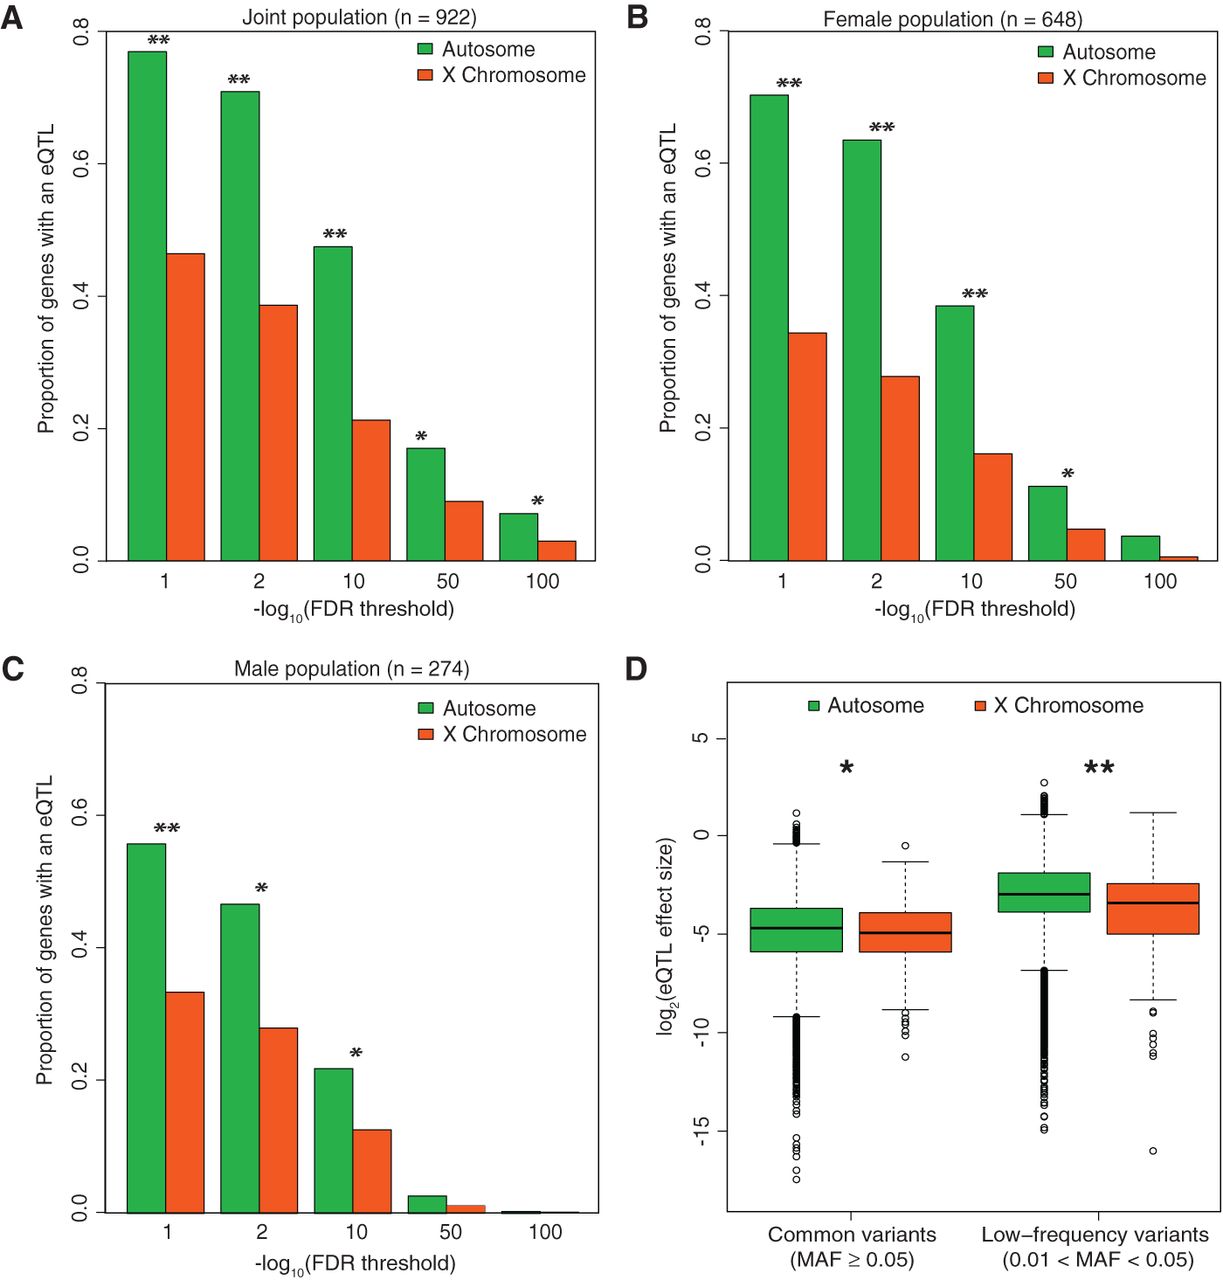
Figure 2.
Characterization of eQTLs on the X Chromosome. (A) Proportion of genes with an eQTL at different FDR thresholds discovered in the joint (n = 922), (B) female (n = 648), and (C) male (n = 274) populations. (**) P-value < 1 × 10⁻¹⁵, (*) P-value < 0.05, Bonferroni adjusted χ2 test. (D) Comparison of eQTL effect size between autosomes and the X Chromosome for common variants (MAF ≥ 0.05) and low-frequency variants (0.01 < MAF < 0.05). The difference in effect size is statistically significant for both common ([*] P-value = 0.0382, two-sided Wilcoxon rank-sum test) and low-frequency variants ([**] P-value = 1.21 × 10⁻⁷).


