
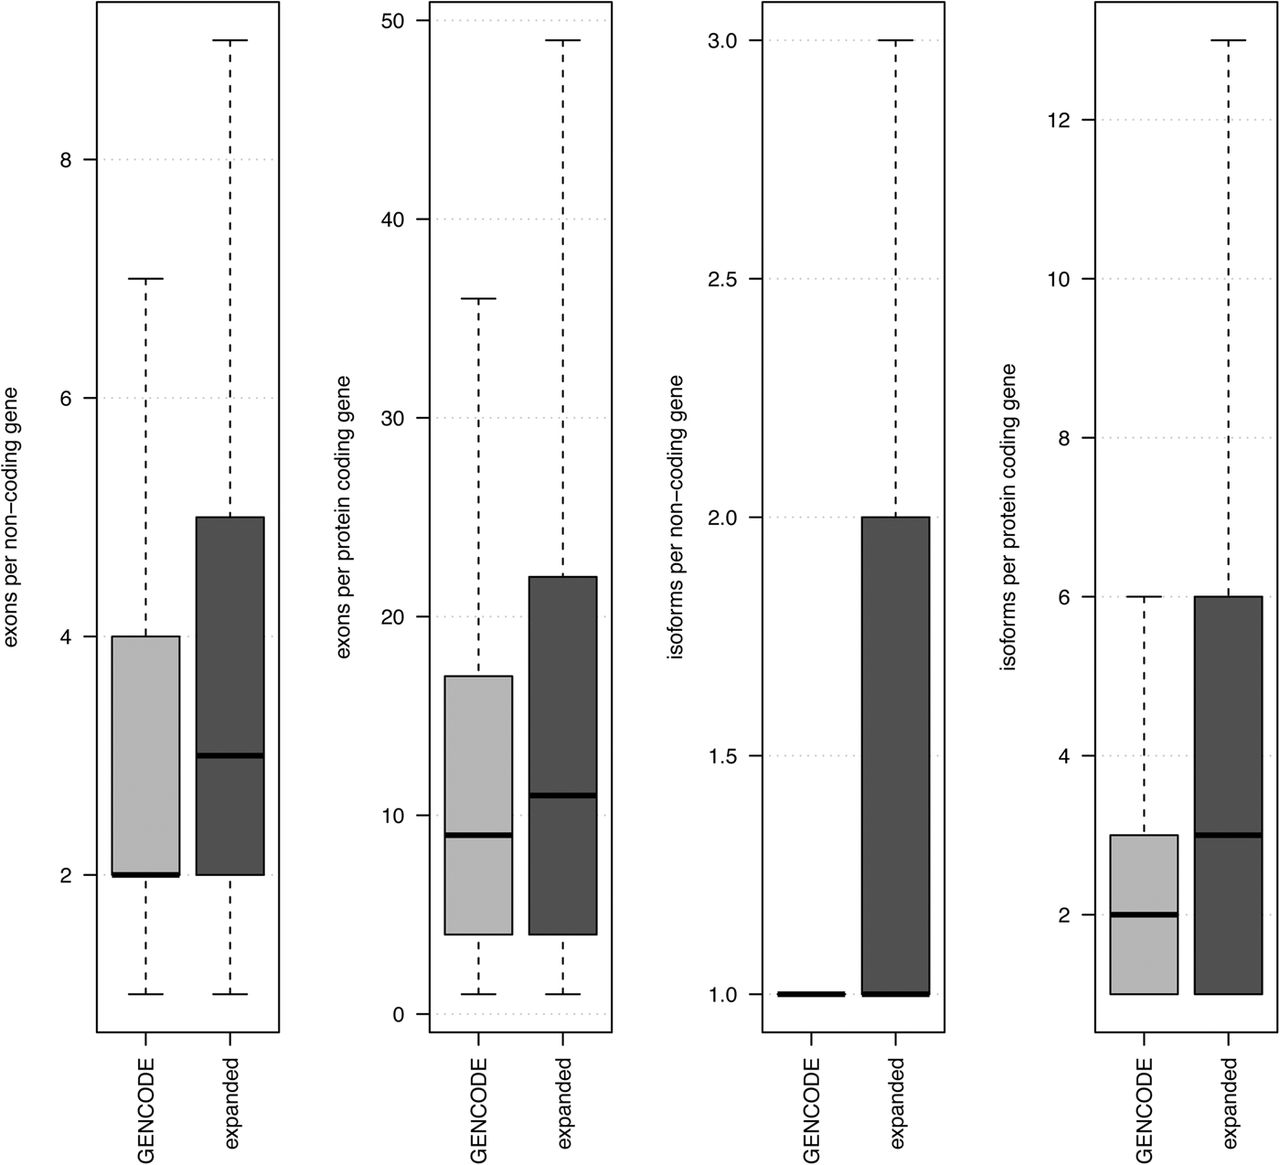
Figure 3.
GENCODE annotation expansion. The light gray box plots indicate GENCODE (M4) annotations. The dark gray box plots indicate GENCODE genes combined with HQ genes. From left to right, the first panel shows the number of exons per annotated GENCODE noncoding gene. The second panel shows the number of exons per annotated GENCODE protein-coding gene. The third panel shows the number of transcript isoforms per annotated GENCODE noncoding gene. The fourth panel shows the number of transcript isoforms per annotated GENCODE protein-coding gene. All the comparisons are statistically significant with a Wilcoxon P-value <0.05.


