
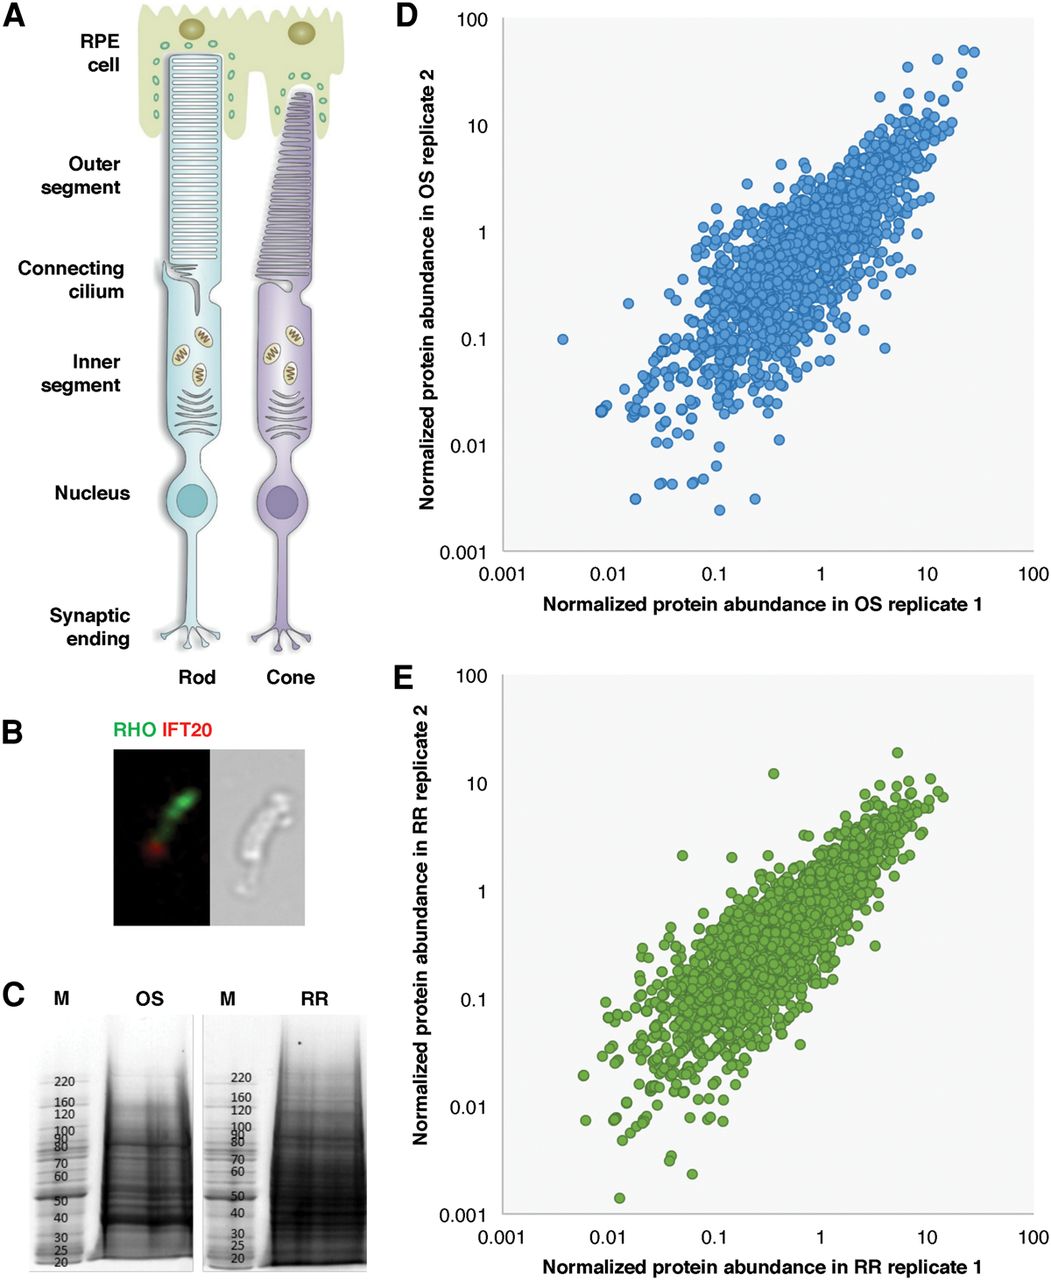
High-quality proteomic data of the OS and the RR were obtained. (A) Schematic diagram of the structure of a rod photoreceptor cell and a cone photoreceptor cell in mouse retina. (B, left) Immunofluorescence of isolated OS preparation stained with antibodies of RHO (green) and IFT20 (red); (right) microscopic analysis of an isolated rod OS. (C) OS protein complex (left) and RR protein complex (right) were electrophoresed. The sizes of the molecular weight markers are indicated in M. (D) Scatter plot of normalized protein abundance for OS proteins between different replicates. The average Pearson correlation between all replicates is 0.85. (E) Scatter plot of normalized protein abundance for RR proteins between different replicates. The Pearson correlation between two replicates is 0.75.


