
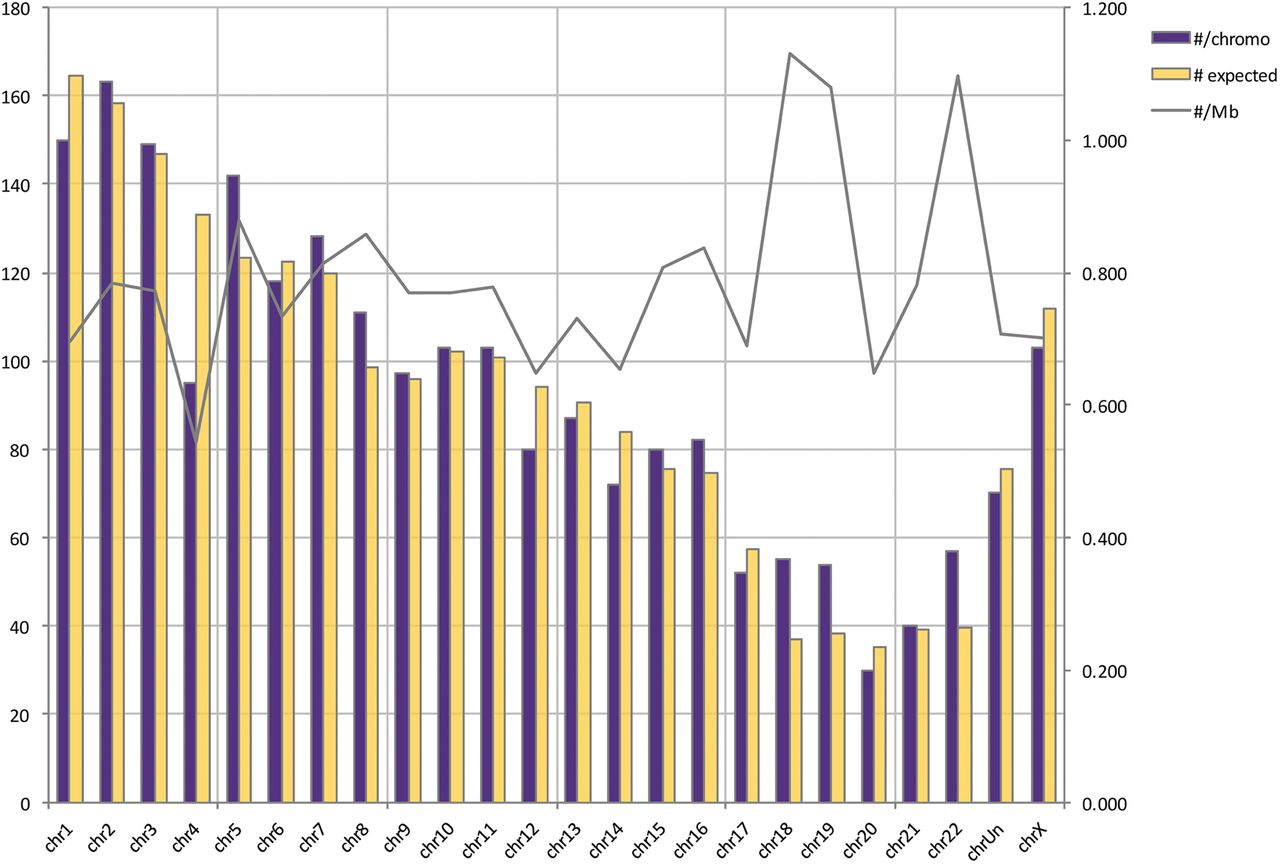
Figure 4.
Platy-1 genomic distribution. The expected (yellow) and actual (purple) Platy-1 distributions across all chromosomes (excluding Chr Random and Chr Y) are illustrated. In addition, the density per megabase is shown for each chromosome. Due to omission of putative Platy-1 loci on Chr Random, 2221 full-length elements were included in this analysis.


