
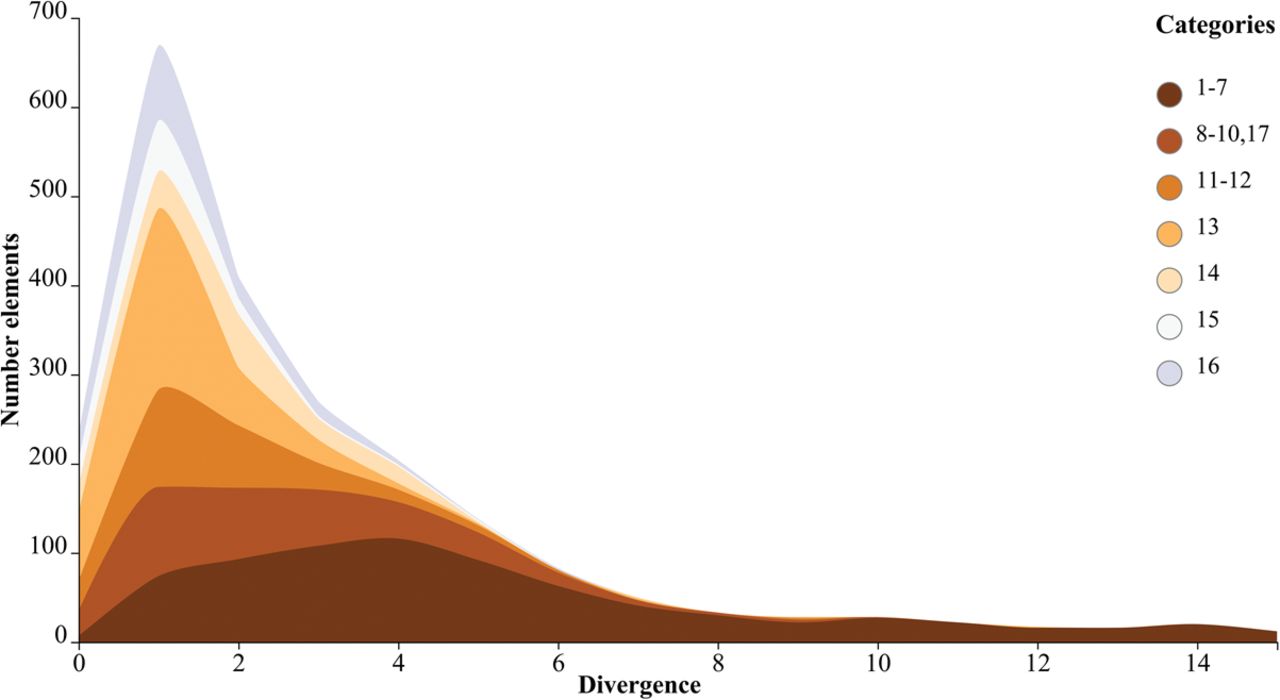
Figure 2.
Platy-1 evolution in NWMs. The histogram shows the Platy-1 distribution based on the divergence from the consensus sequence of all 2268 full-length sequences. The subfamilies are color-coded based on subfamily affiliation and grouped together based on age. The divergence from the respective consensus sequence was retrieved from RepeatMasker and is shown on the x-axis. The y-axis shows the number of elements with the indicated divergence. The plot is generated with custom BioPython scripts and the Vega + D3 Vincent wrapper/package (Bostock et al. 2011) (http://github.com/wrobstory/vincent).


