
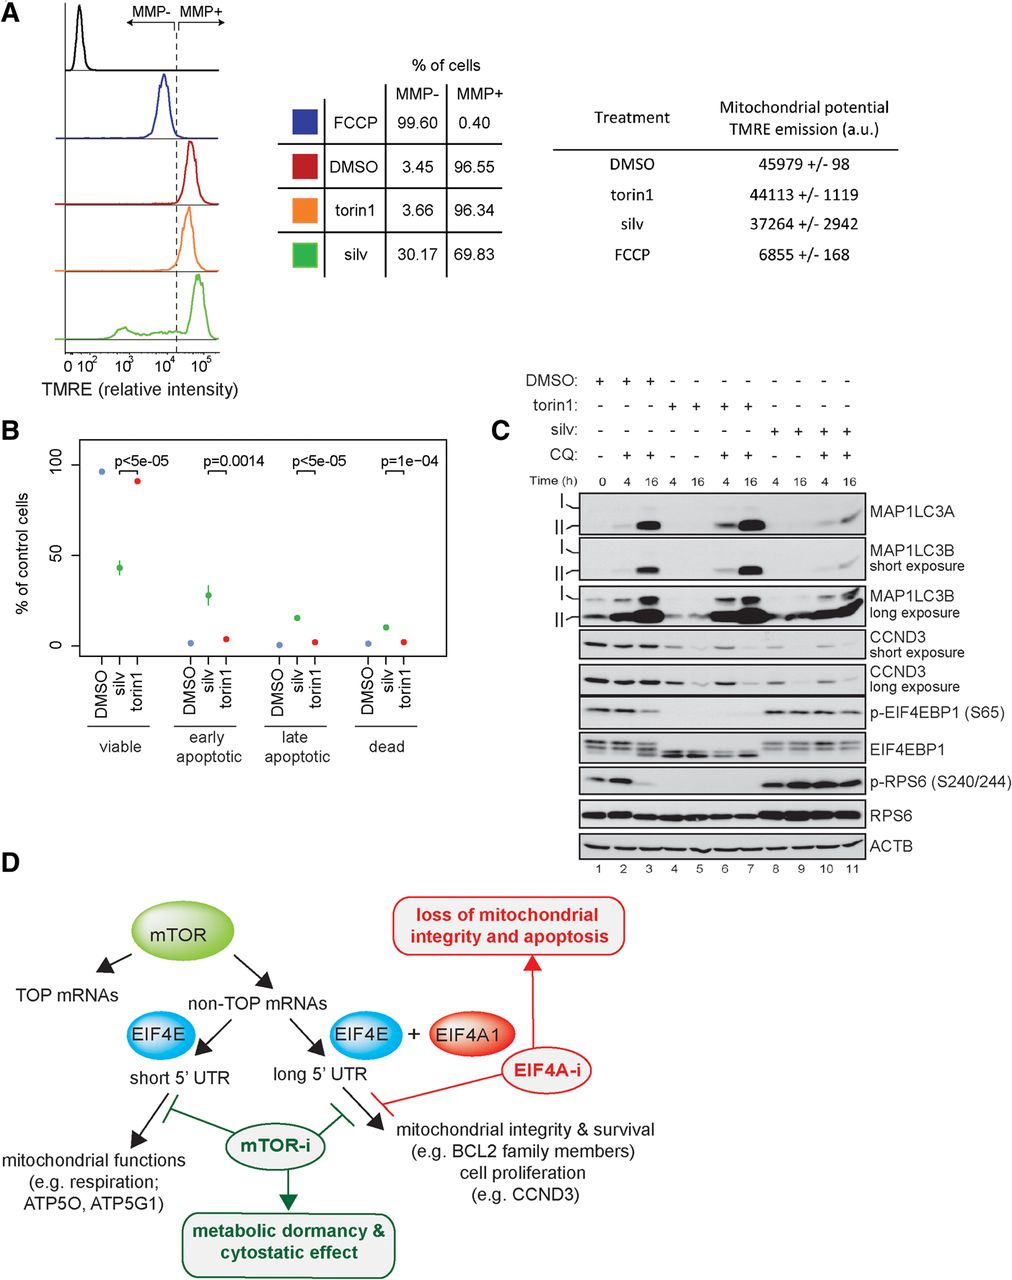
Prolonged (72 h) inhibition of EIF4A1, but not MTOR, compromises mitochondrial integrity and leads to apoptosis. (A) HEK293E cells were treated with torin1 (250 nM), silvestrol (silv; 25 nM), or a vehicle (DMSO) for 72 h. Mitochondrial membrane potential (MMP) was analyzed by monitoring TMRE fluorescence intensity by flow cytometry. As a control, cells were treated with FCCP (20 μM; 10 min) to induce mitochondrial membrane depolarization. (Left panel) The flow cytometry histogram profiles of unstained (control; black) and TMRE stained cells treated with FCCP (blue), a vehicle (DMSO; red), torin1 (orange), or silvestrol (silv; green). Cells harboring depolarized mitochondria (MMP−) were defined as those with a TMRE signal equal to or less than the TMRE signal observed in FCCP-treated cells. (Middle panel) Mean percentage (n = 3) of MMP− and MMP+ cells out of total viable cells (DAPI positive dead cells were excluded). (Right panel) Overall TMRE emission expressed in arbitrary units (a.u.). Results are presented as mean ± SD (n = 3). (B) HEK293E cells were treated as described in A, and apoptosis was measured by flow cytometry using a FITC-Annexin V/PI staining. The fractions (%) of viable (Annexin V−/PI−), early apoptotic (Annexin V+/PI−), late apoptotic (Annexin V+/PI low), and dead (Annexin V+/PI high) cells are shown relative to the total cell population. Results represent means ± SD (n = 3). P-values from one-way ANOVAs are shown. (C) HEK293E cells were treated with torin1 (250 nM) or silvestrol (silv; 25 nM) in the presence or absence of chloroquine (CQ, 50 µM) for 4 and 16 h. Autophagy induction was monitored by the detection of MAP1LC3A/B lipidation (MAP1LC3A-II and MAP1LC3B-II) using appropriate antibodies. The levels and phosphorylation status of indicated proteins were monitored by Western blotting. ACTB served as a loading control. (D) Schematic representation of the model. In addition to 5′ TOP motif (TOP mRNAs), 5′ UTR features define two distinct subsets of non-TOP mRNAs whose translation is stimulated by MTOR (mTOR; green): (1) mRNAs with long 5′ UTRs whose translation is sensitive to both EIF4E (blue) and EIF4A1 (red), which encode pro-survival- (e.g., BCL2) and proliferation-promoting (e.g., CCND3) proteins, and (2) mRNAs with short 5′ UTRs whose translation is sensitive to EIF4E (blue), but not EIF4A1 (red), which encode proteins with mitochondrial functions (e.g., ATP5O). Whereas MTOR-i (mTOR-i; green) suppresses translation of both subsets of mRNAs (1 and 2) leading to metabolic dormancy and cytostatic effect, EIF4A-i (red) selectively inhibits translation of mRNAs with long 5′ UTRs (1), leading to apoptosis.


