
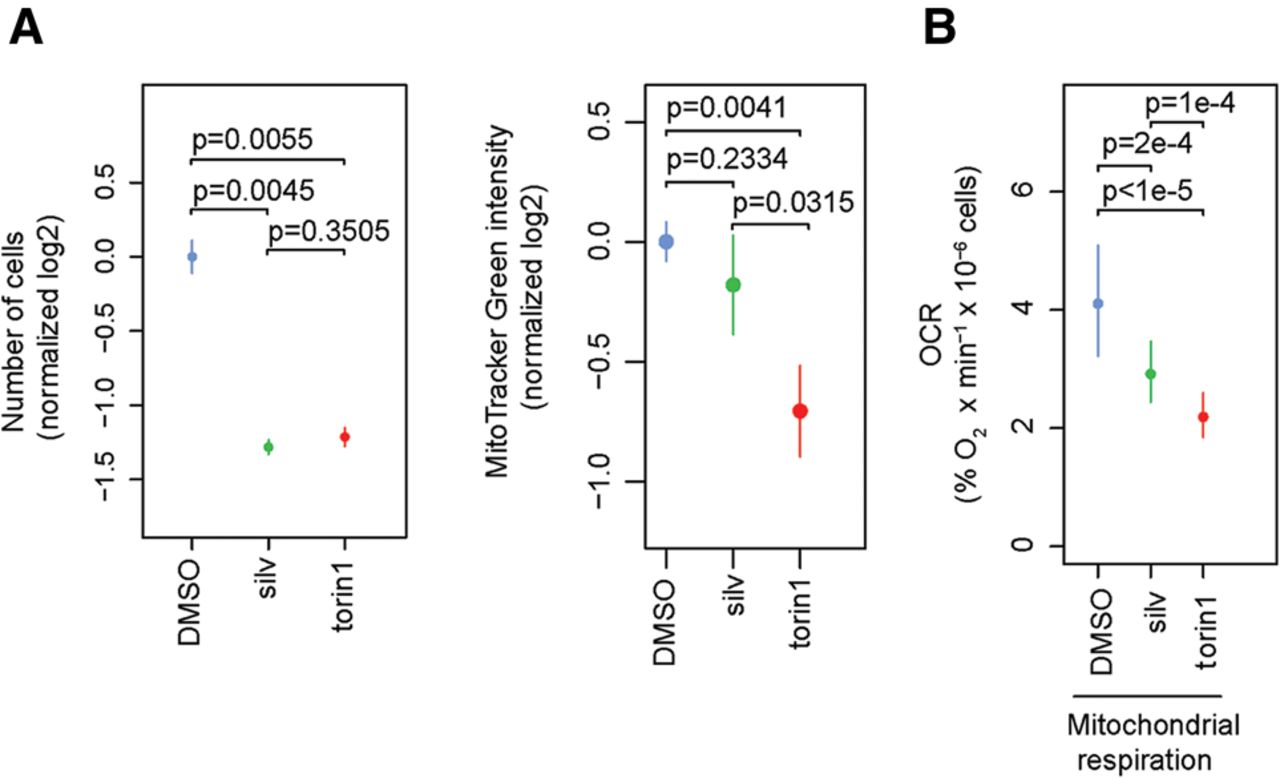
Short-term (16 h) MTOR, but not EIF4A1 inhibition, decreases mitochondrial number and respiration. (A) HEK293E cells were treated with torin1 (250 nM), silvestrol (silv; 25 nM), or a vehicle (DMSO) control for 16 h. Cells were counted to ensure that used concentrations of torin1 and silvestrol result in comparable inhibition of proliferation (left panel), and mitochondrial mass was estimated by monitoring mean fluorescence intensity of MitoTracker Green using flow cytometry (right panel). Data were log2 transformed, normalized per replicate and to the mean of DMSO, and are shown as means ± SD (n = 3). (B) HEK293E cells were treated with torin1 (250 nM), silvestrol (silv; 25 nM), or DMSO for 16 h. Mitochondrial respiration was assessed using a Clark electrode and presented as oxygen consumption rate (OCR). Data are shown as means of four independent experiments (n = 4) ± SD in linear scale. P-values from one-way ANOVAs calculated after log2 transformation and normalization per replicate and to DMSO are indicated.


