
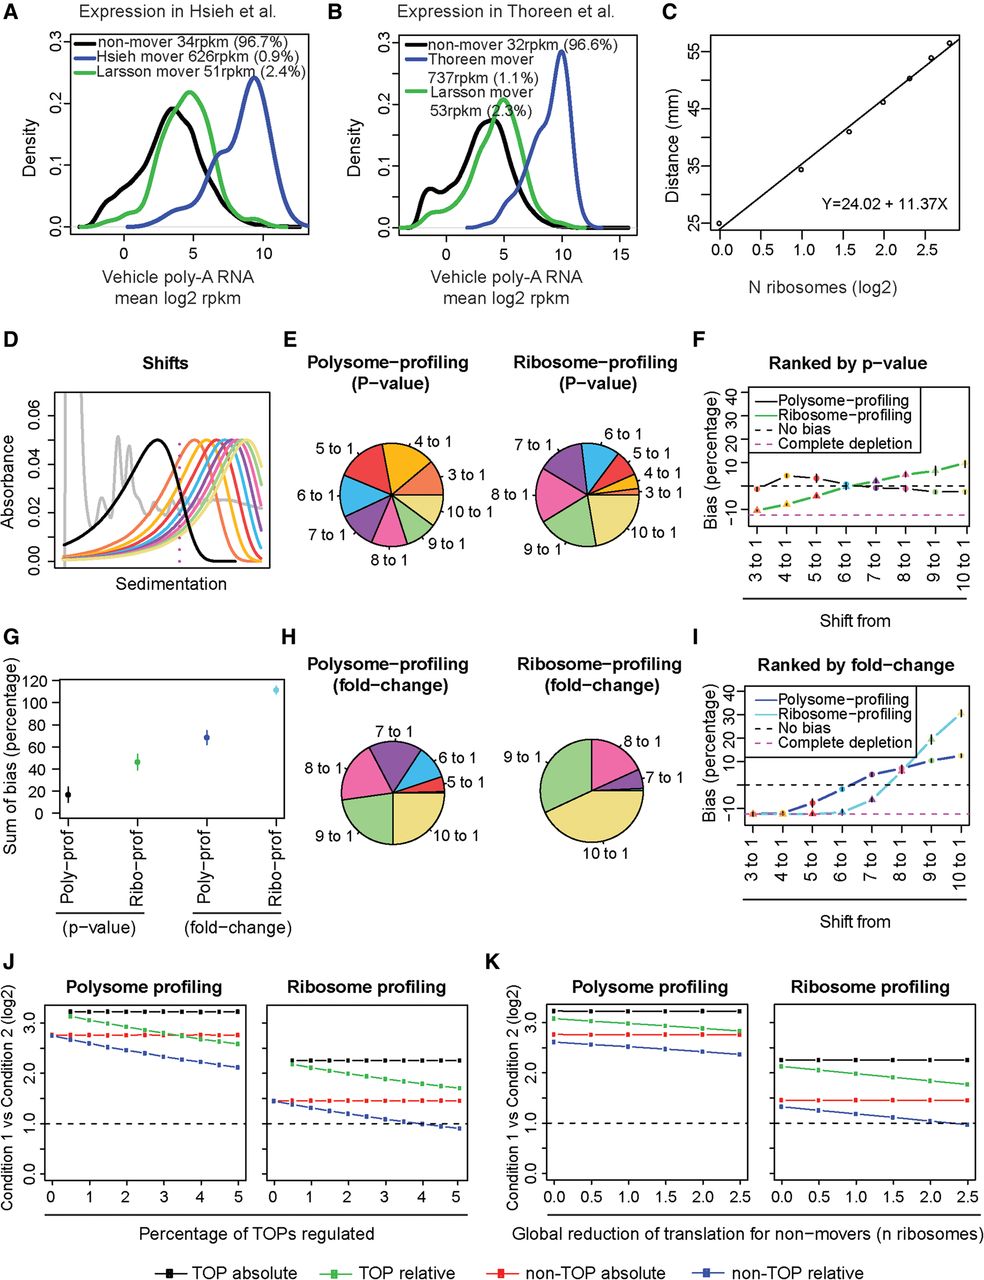
Biases in polysome- and ribosome-profiling studies of translation efficiency. (A,B) Mean expression levels and densities according to data from poly(A)+ RNA for mRNAs identified as differentially translated by ribosome-profiling (Hsieh et al. 2012; Thoreen et al. 2012), which include ∼60%–70% TOP mRNAs; polysome-profiling (Larsson et al. 2012), which includes ∼10% TOP mRNAs; and nonmovers. Percentage of mRNAs and mean reads per kilobase per million mapped reads (RPKM) per subset is indicated. (C) Calculated relationship between number of bound ribosomes and sedimentation in a 5%–50% sucrose gradient. (D) Simulated distributions of ribosome association under a condition when MTOR is inhibited (black) and a range of ribosome association under the control condition. (E,H) Proportions of differentially translated mRNAs identified by polysome- or ribosome-profiling simulations from analyzed shifts in polysome association. Genes were ranked by P-value (E) or fold change (H). (F,I) Observed bias (i.e., obtained percentage of genes from each shift compared to expected percentage) across all shifts. (G) Sums of bias across all shifts for each technology and analysis approach. (F,G,I) Means and standard deviations from four replicated simulations are shown. (J,K) Observed absolute or relative fold changes using polysome- or ribosome-profiling for TOP and non-TOP mRNAs under conditions when an increasing proportion of TOP mRNAs change their translation (J) or when global translation is affected (K).


