
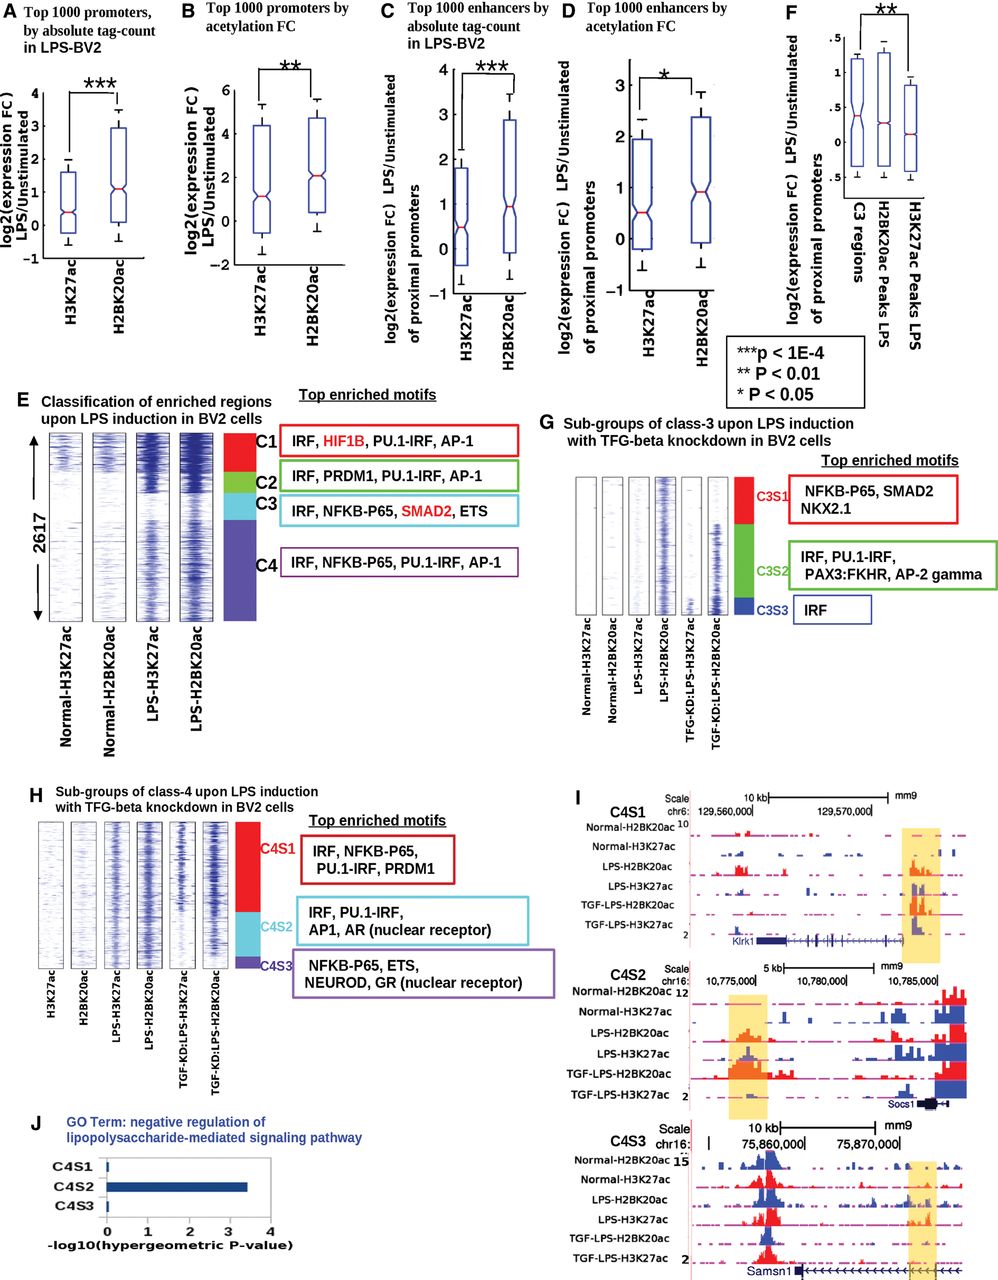
Differential acetylation dynamics during cell-state transition: decoupling of H2BK20ac and H3K27ac at a subset of regulatory regions. (A) Top 1000 promoters sorted by absolute ChIP-seq tag count (H2BK20ac, H3K27ac) in lipopolysaccharide (LPS)-stimulated BV2 cells (LPS-BV2): expression fold change upon stimulation. (B) Similar to A, promoters sorted by gain in ChIP-seq signal (fold change) upon LPS stimulation. (C) Top 1000 enhancers sorted by absolute ChIP-seq tag count (H2BK20ac, H3K27ac) in LPS-stimulated BV2 cells: expression fold change of proximal genes (nearest within 50 kb) after stimulation. (D) Similar to C, enhancers sorted by gain in ChIP-seq signal (fold change) upon stimulation. (E) Chromatin-based clustering of regulatory regions showing greater than fourfold increase in H2BK20ac or H3K27ac upon LPS stimulation of BV2 cells. Top four significantly enriched (P-value <0.01) motifs in each class are shown. (F) Fold change in expression for genes flanking (nearest within 50 kb) C3 regulatory regions, which are marked by increased H2BK20ac but not H3K27ac. Control sets: genes flanking all H2BK20ac or H3K27ac peaks in LPS-BV2. (G) Subclassification of C3 regulatory regions by histone acetylation patterns in BV2 cells stimulated by LPS after TGF-beta inhibition (TGF-KD:LPS). (H) Subclassification of C4 regulatory regions by histone acetylation patterns in TGF-KD:LPS cells. (I) Genome Browser views of sample regulatory regions from C4S1, C4S2, and C4S3 classes (highlighted by yellow). (J) Enrichment of LPS-response genes near regulatory regions belonging to the three subclasses of C4.


