
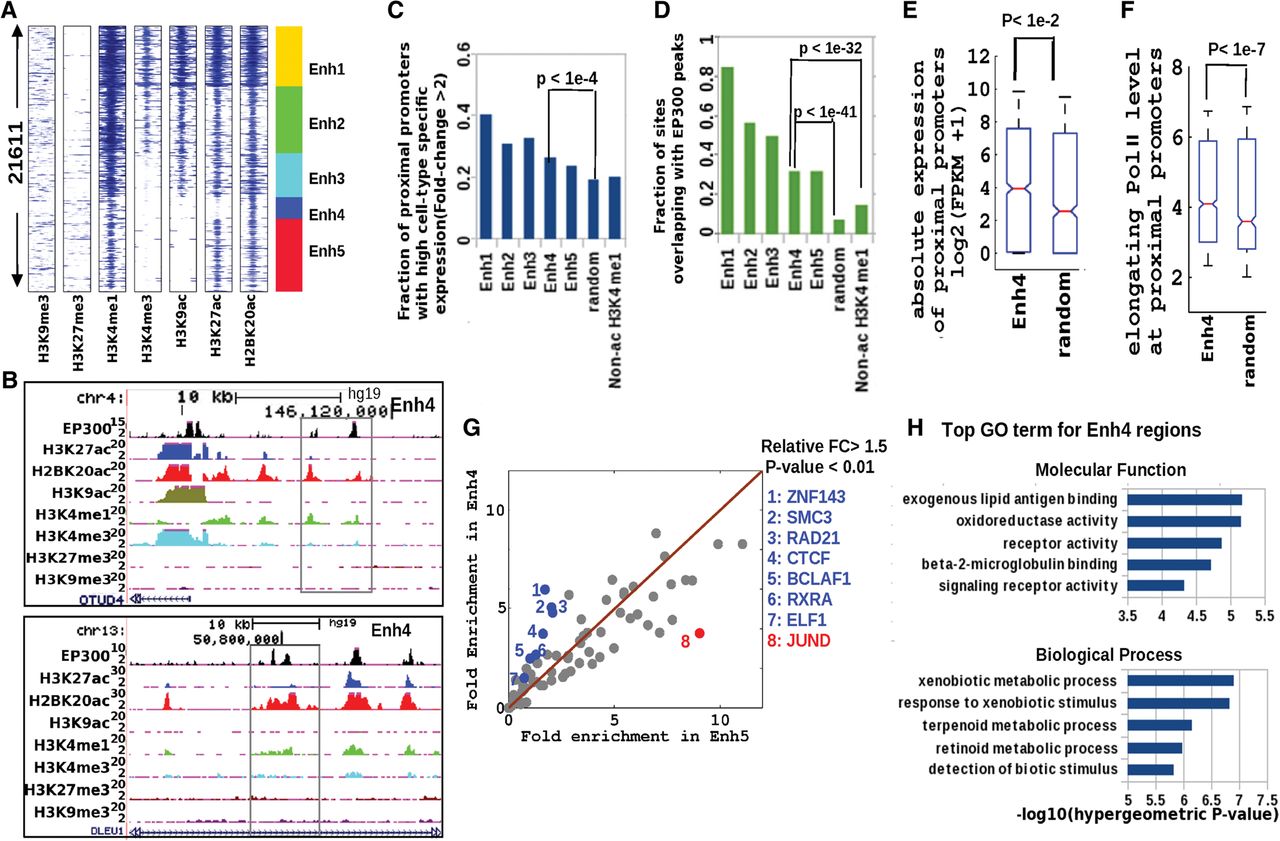
A novel histone acetylation signature at putative distal enhancer regions in GM12878 cells. (A) Clustering of nonpromoter histone-acetylated regions (H2BK20ac or H3K27ac) based on ChIP-seq profiles of seven histone marks. Flanking regions’ width in spatial heatmap is 4 kb, and the number of Enh4 regions is ∼2000. (B) Genome Browser view of two regions from the Enh4 class (black boxes), showing H2BK20ac and EP300 binding in the absence of the two other acetylation marks. (C) Cell-type-specific expression of promoters proximal (closest within 100 kb) to enhancer regions of different classes compared to randomly chosen regions and also regions marked by H3K4me1 but not by histone acetylation (non-ac H3K4me1). (D) EP300 occupancy of the same sets of regions. (E) Absolute expression (FPKM) of promoters proximal to Enh4 regions relative to random regions. (F) Elongating (S2-phosphorylated) Pol II ChIP-seq signal at proximal promoters of the same regions. (G) Fold excess above genomic background of TF binding sites (ChIP-seq peaks) in Enh4 and Enh5 regions. (Blue dots) TFs enriched more in Enh4 than in Enh5 (P-value <0.01, FC > 1.5). (Red dots) TFs enriched more in Enh5 than in Enh4. (H) Top five enriched functional categories of genes proximal to Enh4 regions (GREAT gene ontology tool).


