
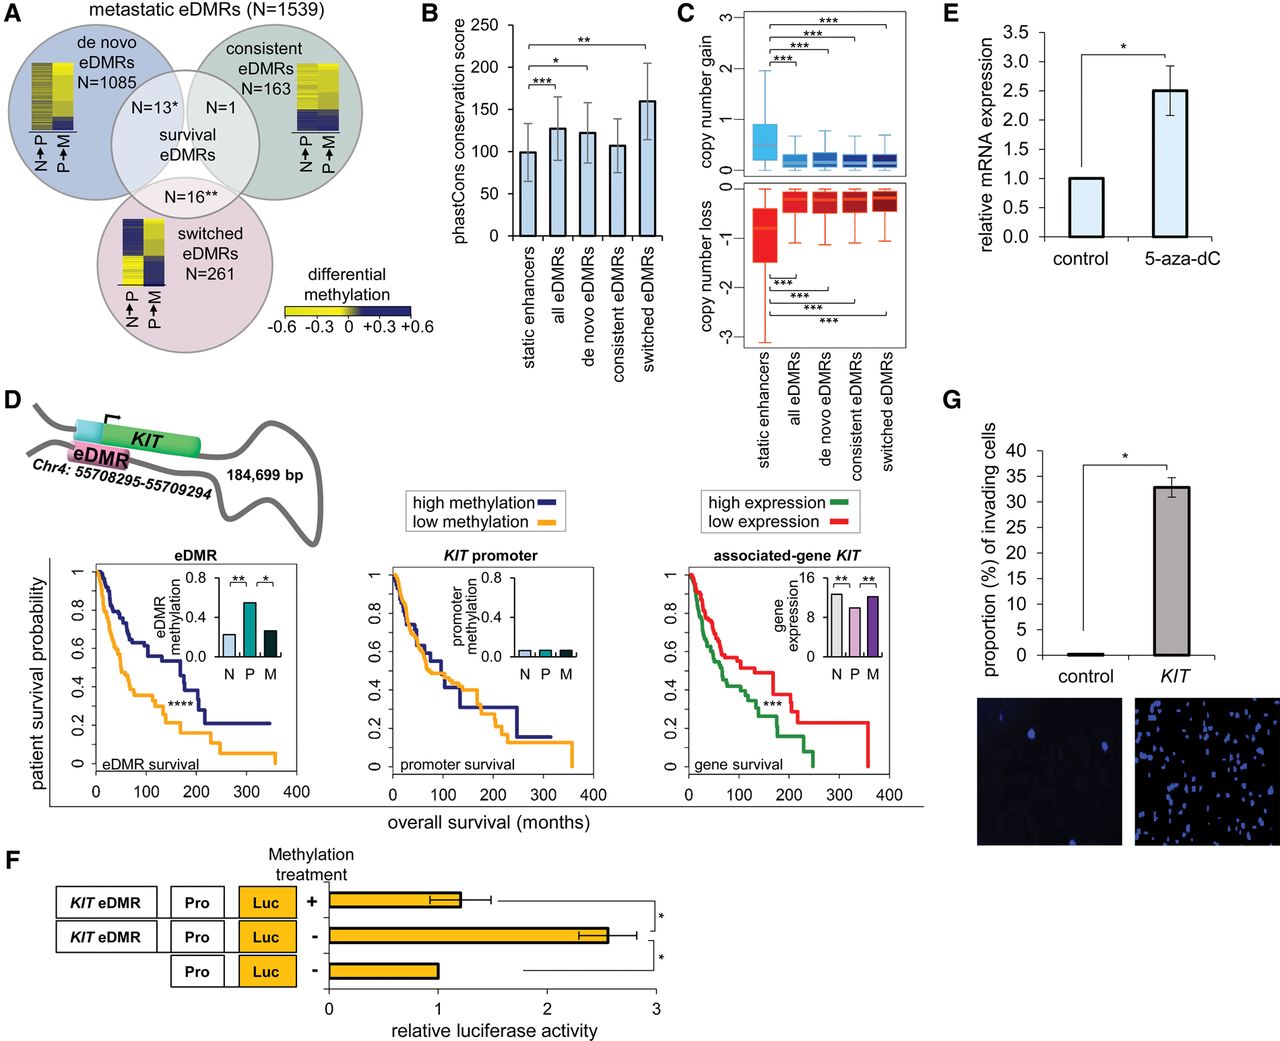
Methylation plasticity of melanoma eDMRs is associated with patient mortality. (A) Venn diagram of three types of eDMRs found in metastatic melanoma: “de novo,” “consistent,” and “switched” (described in text). Heat maps display differential methylation between normal melanocytes and primary melanoma (N→P), and between primary and metastatic melanoma (P→M). “Switched” eDMRs are enriched for “survival” eDMRs and “de novo” eDMRs are depleted, hypergeometric distribution; (**) P = 9.4 × 10⁻⁵, (*) P = 1.6 × 10⁻², respectively. Numbers represent amount of eDMRs in each category. (B) PhastCons conservation scores of enhancers' sequence conservation, switched eDMRs exhibit the highest sequence conservation (see Methods) compared to all other enhancers. Two-way ANOVA analysis; (*) P = 4.2 × 10⁻⁶, (**) P = 9.9 × 10⁻¹⁰, (***) P = 2.9 × 10⁻¹¹; bars represent average sequence conservation, error bars represent standard deviation. (C) Copy number variations (CNVs) are infrequent within eDMRs compared to static enhancers. Two-way ANOVA analysis; (***) P < 2 × 10⁻¹⁶. (D) (Top) Schematic representation of the eDMR-gene pair: Chr4:55708295–55709294 and KIT gene. The eDMR (pink) is interacting with the promoter (cyan) of KIT gene (green) through chromatin looping. The distance between the eDMR and the transcription start site (TSS) is noted in the schematic. (Bottom, left) Kaplan–Meier survival plot shows significant differences between survival times of patients based on the methylation levels of the eDMR of the gene KIT (χ2, [****] P = 2.9 × 10⁻⁴). Patients were divided into two groups of higher (blue) and lower (yellow) methylation levels compared to the median (see Methods). (Middle) Plot shows that patients with higher or lower methylation of the KIT promoter show no significant difference in survival rates. (Right) Plot shows significant differences between survival times of patients with higher (green) and lower (red) expression levels of KIT (χ2, [***] P = 2.4 × 10⁻³). (Insets, left and right) Both eDMR methylation and KIT expression exhibit switched patterns between normal melanocytes (N), primary melanoma (P), and metastatic melanoma (M). (Middle inset) KIT promoter does not exhibit switched methylation patterns. (*) q < 0.05, (**) q < 0.01. (E) Inhibition of DNA methylation increases KIT expression. WM3682 melanoma cells were treated with 10 µm 5-aza-dC or DMSO (control); KIT mRNA expression was normalized to levels of GAPDH. Data are relative to levels in control-treated cells. Error bars represent ± SEM; (*) P < 0.05; N = 3. (F) WM3682 melanoma cells were transfected with methylated KIT-eDMR reporter plasmid, unmethylated KIT-eDMR reporter, or reporter without eDMR (control). Firefly luciferase activity was normalized to Renilla luciferase activity. Fold-changes are relative to control. Error bars represent ± SEM; (*) P < 0.05; N = 3. (G) (Top) KIT overexpression increases melanoma invasiveness. WM3682 melanoma cells were transfected with KIT expression vector or empty vector (control); invasion ability was analyzed. Error bars represent ± SEM; (*) P < 0.05; N = 3. (Bottom) A representative image of invading cells.


