
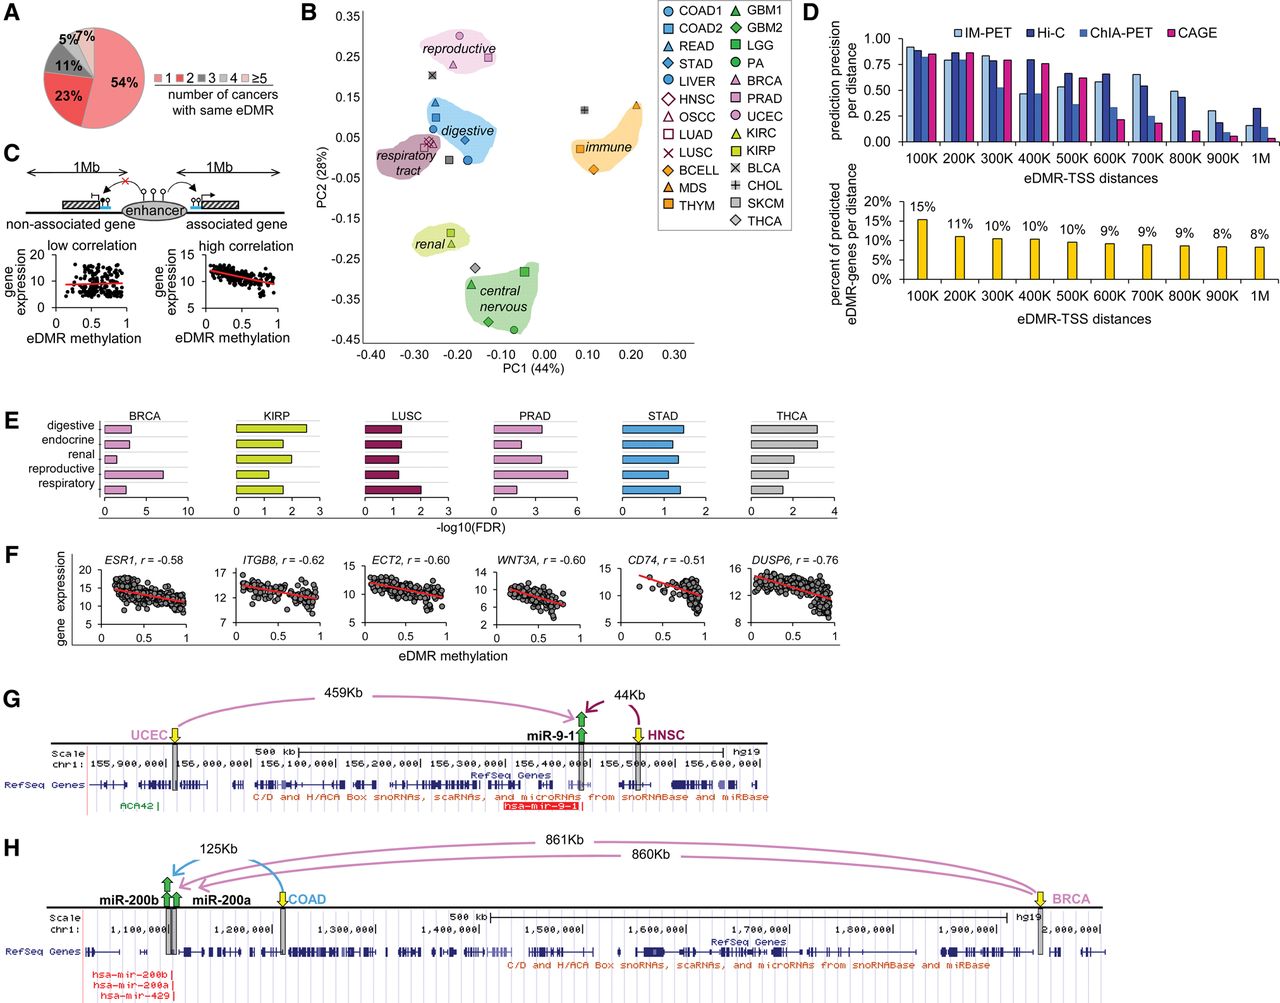
Variation in enhancer methylation classifies primary tumors according to their organ systems. (A) Pie chart shows that most eDMRs are unique (77% of the eDMRs appear in only one or two cancers, excluding the same cancer type, e.g., GBM1 and GBM2). (B) Principal components analysis (PCA) shows that differential methylation patterns of eDMRs are similar for cancers belonging to the same organ systems (circled and colored similarly). First and second principal components (x-axis: PC1; y-axis: PC2) account for 72% of variation (see Supplemental Fig. S2A–C for PCA analysis of methylation changes within CpG islands, promoters, and intergenic regions). (C) Schematic of method for identification of eDMR-gene and eDMR-miRNA pairs (see Supplemental Fig. S2H for flow chart). (D) (Top) Precision of eDMR-gene pair predictions is compared to predictions from CAGE (Andersson et al. 2014), IM-PET (Teng et al. 2015), ChIA-PET, and Hi-C (Teng et al. 2015) methods (see text). (Bottom) Percent of predicted eDMR-gene pairs. Results in both plots are divided into groups based on the distances between eDMR and transcription start site (TSS). Most predictions (>56%) lie within a distance of <500 kb (abbreviations: 100K, 0–100,000 bp, 200K: 100,001–200,000 bp, and so forth). (E) eDMR-associated genes are distinctly enriched for genes involved in diseases related to a particular organ system. Disease-related genes were derived from the DISEASES database (see Methods). Scores represent −log10(FDR-corrected P-values). (F) Scatter plots (a point for each patient) show examples of tissue-specific genes linked to cancer risk and their eDMRs (the same six cancer types shown in E). Spearman's correlations between eDMRs methylation and associated-gene expression are shown. (G) Landscape of two differentially hypomethylated eDMRs in uterine (UCEC) and head and neck (HNSC) cancers, associated with a single miRNA, miR-9-1, which is up-regulated in both cancers. (H) Landscape of two differentially hypomethylated eDMRs in breast (BRCA) and colon (COAD) cancers associated with two miRNAs of the same family, miR-200a and miR-200b; each is up-regulated in the respective tumors. In G,H, yellow arrows mark hypomethylated eDMRs, green arrows mark up-regulated miRNAs; gray boxes mark eDMR and miRNA regions in the hg19/GRCh37 genome; distances between miRNAs and eDMRs are indicated on arrows. All parts of the figure refer to eDMRs determined between normal samples and primary tumors.


