
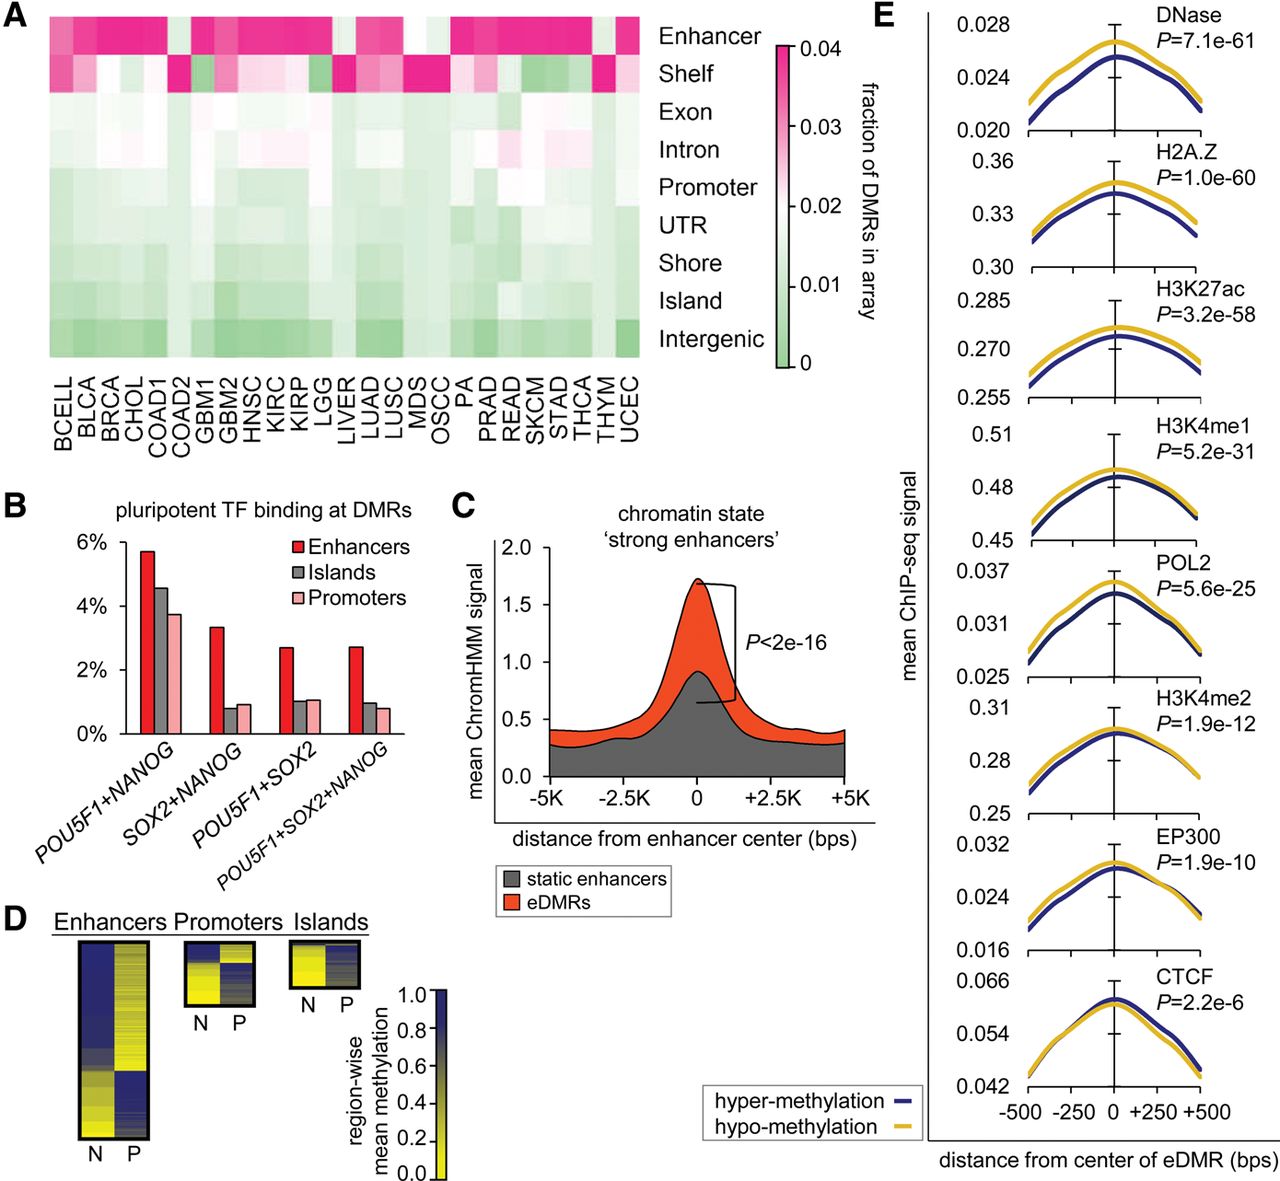
Enhancers exhibit highly dynamic methylation patterns upon malignant transformation. (A) Heat map shows that across 25 cancer data sets (x-axis) differential methylation occurs mostly within enhancer regions. Colors indicate high (pink) to low (green) relative amount of DMRs in Illumina HumanMethylation450 arrays (see Supplemental Fig. S1C for differentially methylated CpG sites and Fig. 3A for regions differentially methylated between primary and metastatic cancer). (B) ChIP-seq signals of pluripotency transcription factors (TFs) POU5F1, SOX2, and NANOG are higher within differentially methylated enhancers (eDMRs) than within differentially methylated CpG islands or promoters; average peaks across all cancer data sets are shown. (C) “Strong enhancer” ChromHMM chromatin annotation state (see Supplemental Table S2 for cell lines) is more enriched within differentially methylated enhancers (orange area) than within enhancers that are not differentially methylated (gray area). (D) Direction of methylation change between normal tissue (N) and primary cancer (P) in differentially methylated enhancers, CpG islands, and promoters. Coloring indicates high (blue) to low methylation levels (yellow); heat map heights are relative to amount of the differentially methylated enhancers. (E) Hypomethylated eDMRs exhibit footprints of open chromatin marks: increased DNase I hypersensitivity, increased POL2 and EP300 occupancy, increased H2A.Z, H3K4me1, H3K4me2, and H3K27ac marks, and decreased CTCF binding. In contrast, hypermethylated eDMRs exhibit footprints of closed chromatin. P-values were calculated with two sample Student's t-tests and FDR-adjusted. See Supplemental Figure S1D,E for chromatin marks in other cell states and Supplemental Table S2 for cell lines information. All parts of the figure refer to DMRs determined between normal samples and primary tumors.


