
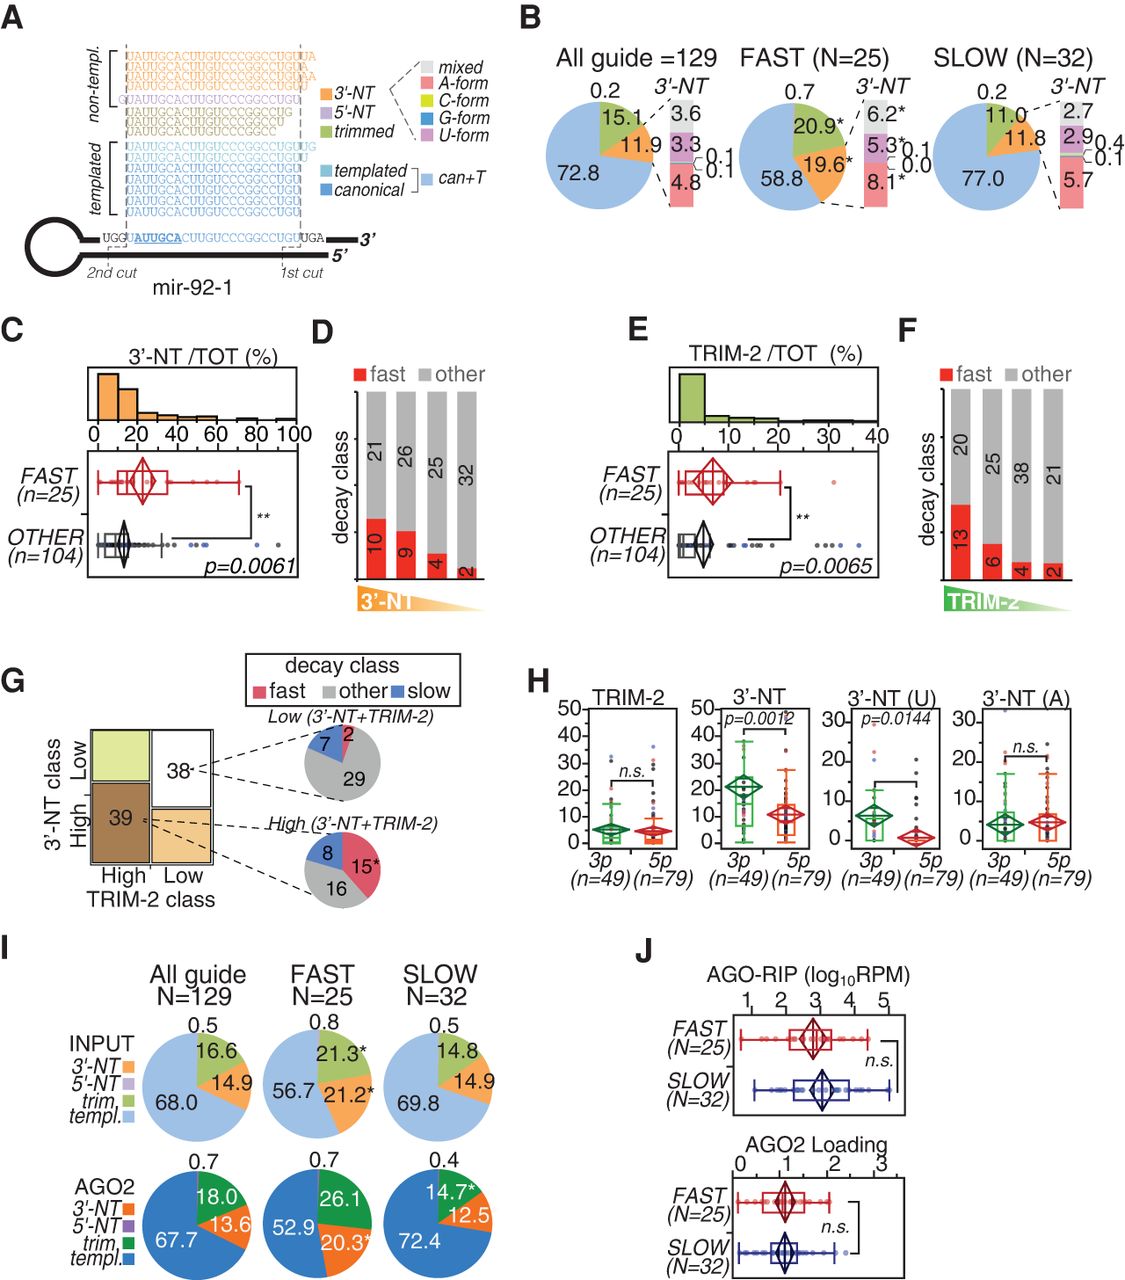
miRNA isoforms (isomiRs) and decay. (A) The scheme illustrates the type of isomiRs that are generated starting from mouse mir-92-1, which is used as the model. Dashed lines mark the two cuts (by DROSHA and DICER1) that generate the “canonical” mature miR-92a-1-3p. Alternative cuts originate “templated” (T) isoforms, while tailing by terminal transferases produces nontemplated (NT) species, which are further distinguished according to the nucleotide added. (B) The pie charts show the frequency of isomiRs for all the guide miRNAs included in the decay data set or just those of the “fast” and “slow” subsets. Data refer to the average of three independent sequencing experiments (shown in Supplemental Fig. S3A,B). Asterisks mark significant values (P < 0.001, paired t-test). (C,E) Distribution of 3′-NT isoforms (C) or trimmed isoforms (“Trim-2,” which includes only species shortened by at least two bases) (E) between “fast” and nonfast (other) miRNA subsets. (**) P < 0.01, Wilcoxon test. (D,F) Guide miRNAs were distinguished into classes (quartiles) according to the amount of 3′-NT (D) or Trim-2 (F) modifications and were correlated with “fast” decay by contingency analysis (3′-NT χ2 = 9.6, P = 0.0235; Trim-2 χ2 = 12.1, P = 0.0069). (G) Co-occurrence of 3′-NT and Trim-2 modifications determined by contingency analysis (χ2 = 5.35, P = 0.0207). The two classes with concordant “high” or “low” tailing/trimming are highlighted and further distinguished by decay classes. (*) P < 0.01, contingency test. (H) Frequency of 3′-NT or Trim-2 modifications in miRNAs distinguished by arm type (3p or 5p). 3′-NT forms were further distinguished in uridylated (U) or adenylated (A) variants. (I) The pie charts show the frequency of isomiRs in the AGO2-RIP (“AGO2”) experiments compared with the total RNA (“Input”) used as input. (*) P < 0.001, paired t-test. (J) Abundance (top; [RPM] reads per million, log10 scale) and loading efficiency (bottom; AGO2/input ratio) of “fast” and “slow” miRNAs associated with AGO2, as measured by AGO2-RIP. Data are the average of three independent biological experiments. (H,J) P-values were calculated by the Wilcoxon test.


