
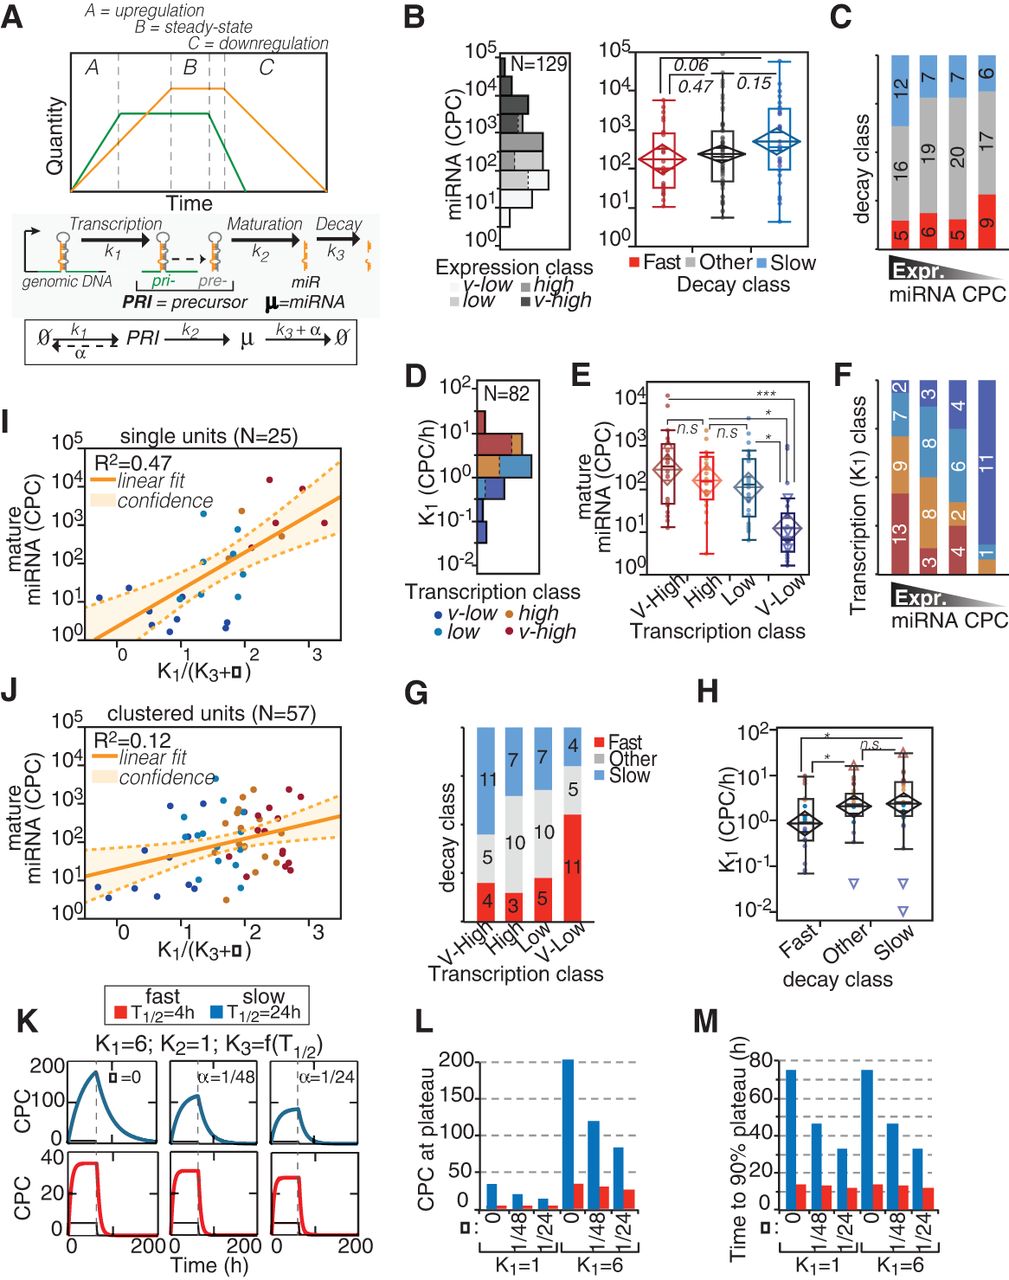
Regulation of miRNA expression by transcription and decay. (A) The scheme describes the variations of miRNA (yellow) expression in time according to changes in transcription of pri-miRNA (green). The regulation of miRNA expression (µ) is dependent on transcription, maturation, and decay rates (k1, k2, and k3, respectively) and on dilution by cell division (α). Half-life (T1/2) and k3 are related: [T1/2 = ln(2)/(k3 + α)]. (B,C) The absolute expression of miRNAs in cells (log10 scale) was correlated with miRNA decay. (B) According to the distribution of miRNA expression in 3T9 cells (histogram on the left), four expression classes (quartiles, highlighted in gray scale) could be defined. The box-plot (right) shows the abundance of miRNAs by decay class. P-values were calculated by Wilcoxon test. (C) The distribution of miRNA decay rates along the expression classes was analyzed by contingency (χ2 = 4.7, P = 0.585). (D–F) The expression of miRNAs in cells was correlated with miRNA transcription, expressed as copies of pri-miRNA per cell (CPCs) (which is k1; log10 scale). (D) Distribution of transcription rates of 82 miRNA loci. The color code defines the four transcription classes (quartiles) in the distribution. (E) The abundance of miRNAs (CPCs; log10 scale) was correlated with transcription classes as in B. (*) P < 0.05; (***) P < 0.001; Wilcoxon test. (F) The distribution of miRNA transcription rates among the expression classes was analyzed by contingency (χ2 = 38.07, P < 0.0001). (G,H) The transcription of miRNAs (CPC/h, log10 scale) was correlated with the decay of mature miRNAs by contingency test (χ2 = 13.06, P = 0.0421; G) and by one-way analysis (H). Asterisks mark significant values (P < 0.05). (I,J) The expression of miRNAs at steady state (“B zone”; A) was inferred using the kinetic parameters (k1 and k3), which were measured by “pulse labeling” and “pulse-chase” experiments, respectively. Scatter plots show the fitting of experimental (CPCs, log scale) and theoretical (k1/[k3 + α], log scale) copies, for miRNAs transcribed as single units (I) or clustered units (J). Straight and dashed lines mark linear correlation and 95% confidence intervals, respectively. (K) Mathematical modeling of accumulation and degradation dynamics of miRNAs (thick colored line) and pri-miRNAs (thin black line) by defined kinetic parameters and according to different proliferation states (α = 1/TD, doubling time). The dashed vertical line marks when synthesis was shut off. The blue and red lines highlight the behavior of slow and fast decaying miRNAs, respectively. (L,M) Bar graphs show the theoretical values of miRNA abundance at plateau (CPCs; L) or the time required to reach 90% of the plateau (in hours; M) inferred by modeling. Values are reported according to indicated k1 and T1/2 in cells, further distinguished by cell proliferation rates (α, as in K).


