
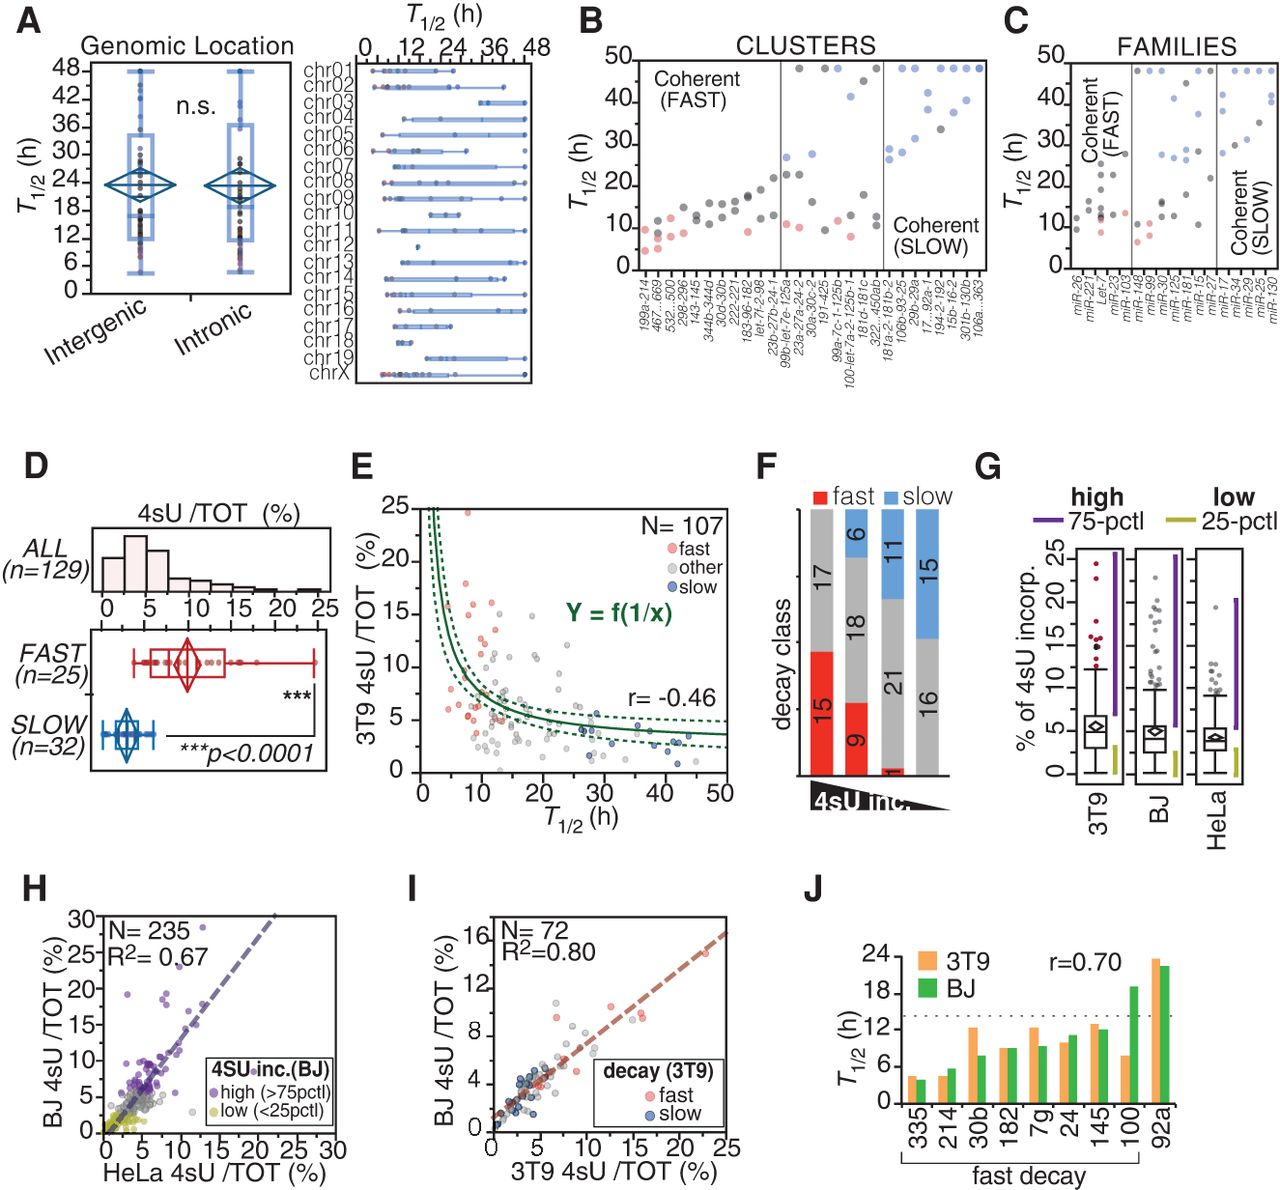
Correlation of decay dynamics with genomic and functional properties of miRNAs. (A, left) The distribution of half-lives for intergenic versus intronic guide miRNAs (N = 129) is shown (P = 0.7488, Wilcoxon test). (Right) miRNA half-lives are reported according to chromosomal location of miRNA loci. (B,C) miRNAs belonging to the same transcriptional unit (cluster) or sequence similarity group (family), according to miRBase 21, were analyzed. Clusters and families with coherent behavior (differences in T1/2 < 12 h) are shown. A color code indicates miRNA decay class (red, “fast”; blue, “slow”). (D–F) 4sU incorporation in miRNAs was correlated with decay. (D) The histogram shows the distribution of the incorporation rates of guide miRNAs, while the box-plot compares fast versus slow decaying miRNAs (P < 0.0001, Wilcoxon test). (E) miRNA half-lives plotted against 4sU incorporation rates. The curved line highlights the reciprocal relationship between decay and incorporation. The dashed curves mark 95% confidence intervals. Coefficient of determination (R2) is shown. (F) Guide miRNAs were distinguished into four classes (quartiles of 4sU incorporation rates). Shown is the distribution of “fast” and “slow” miRNAs among the four classes by contingency (χ2 = 44.8, P < 0.0001). (G) The box plots show the distribution of 4sU incorporation rates in the different cell lines. Purple and yellow lines mark areas of high and low incorporating miRNA species, respectively. (75-PCTL) More than 75th percentile; (25-PCTL) less than 25th percentile. (H) The scatter plot compares the 4sU incorporation rates in HeLa and BJ human cells. The dashed line highlights the linear correlation, and the coefficient of determination (R2) is shown. (I) The scatter plot compares 4sU incorporation rates in human (BJ) and mouse (3T9) fibroblasts. Only miRNAs that are perfectly conserved between human and mouse were considered in the analysis (N = 72). (J) Half-lives of nine miRNAs were measured in human BJ cells by the pulse-chase method and compared with those from mouse 3T9 cells. The dashed line indicates the cut-off (T1/2 < 14 h) previously used for classifying miRNAs as fast decaying in 3T9 cells. The Pearson correlation coefficient (r) is shown.


