
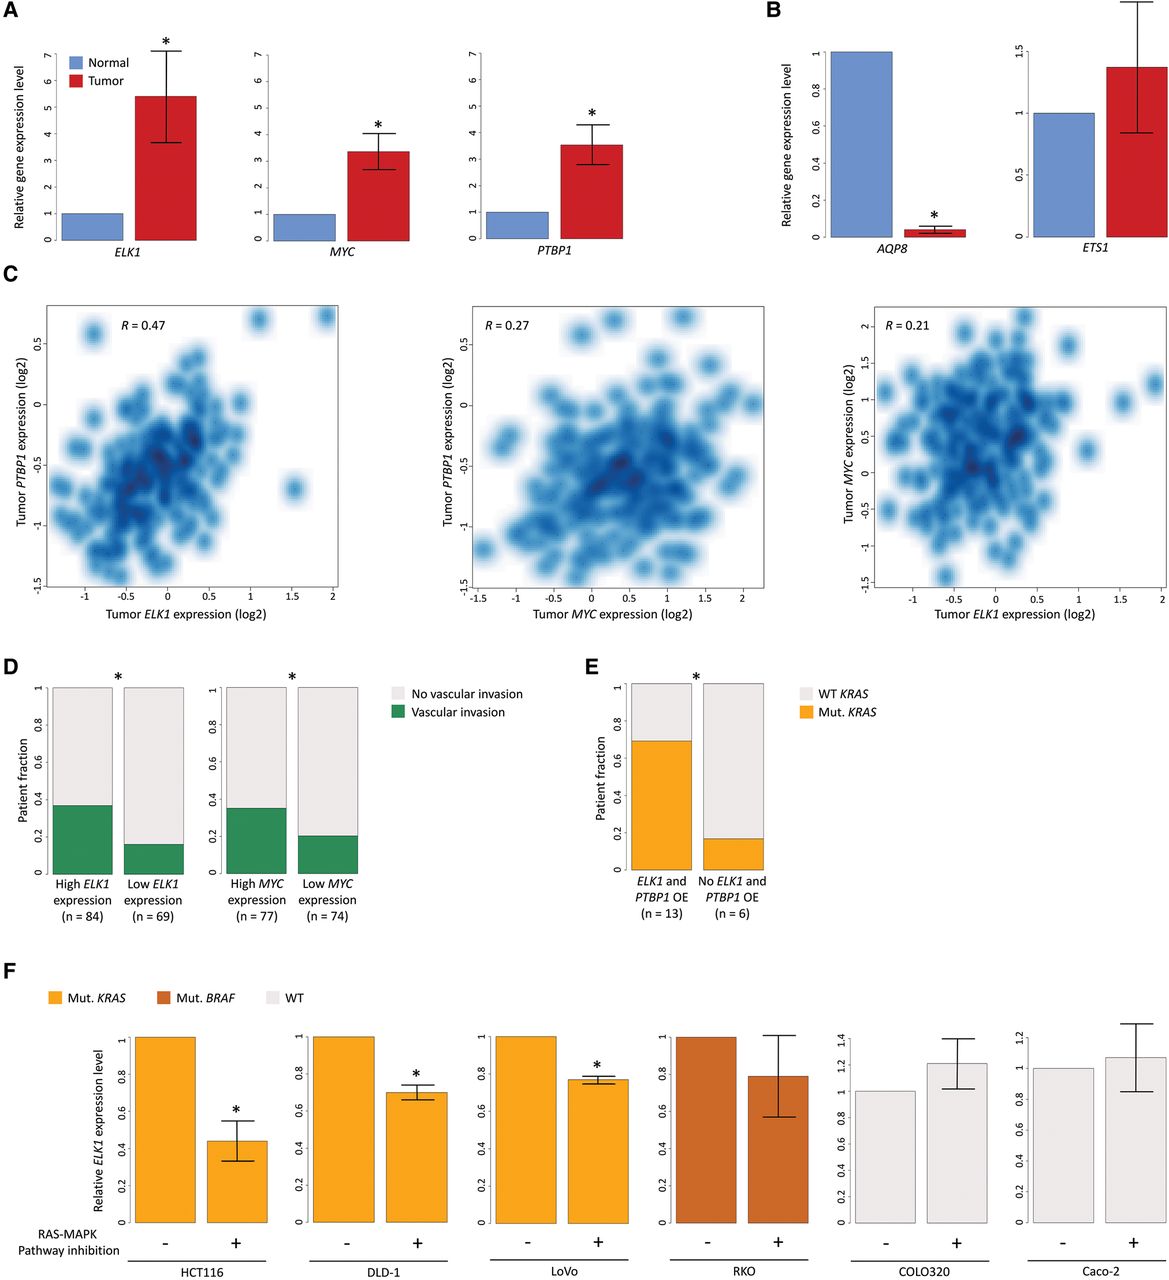
ELK1, MYC, and PTBP1 overexpression in colon tumors compared with matched normal colons results from KRAS activating mutations. (A,B) Total RNA was isolated from colon adenocarcinoma and matched normal colon samples and analyzed by qRT-PCR. (A) Mean gene expression levels of ELK1, MYC, and PTBP1 in tumors relative to their matched normal tissues in patients exhibiting tumor overexpression of ELK1 and PTBP1 (n = 12). Asterisks indicate P = 0.02, P = 0.04, and P = 0.01, respectively; one-sided Student’s t-test. (B) As in A, but of AQP8 and ETS1 in patients exhibiting AQP8 tumor underexpression (n = 15). All values were normalized to HPRT1 and GAPDH in the same sample. Error bars, SEM. (C) Smoothed color density representation of the Pearson correlations between the expression levels (log2) of ELK1 against PTBP1 (left), MYC against PTBP1 (middle), and ELK1 against MYC (right) in 222 colorectal tumor samples. (D) Fraction of patients bearing tumor vascular invasions among those displaying high ELK1 (left) and MYC (right) expression levels and among those exhibiting low ELK1 and MYC expression levels. Asterisks indicate P = 0.003 and P = 0.03, respectively; one-sided Fisher’s exact test. (E) Fraction of patients bearing KRAS mutations (Mut.) among those overexpressing (OE) ELK1 and PTBP1 in tumors compared with normal tissues (in A) and among those that do not. Asterisk indicates P = 0.05; one-sided Fisher’s exact test. (F) HCT116, DLD-1, LoVo, RKO, COLO320, and Caco-2 cells were treated with U0126 for 24 h, and total RNA was isolated. Bars, mean ELK1 gene expression levels measured by qRT-PCR in three independent experiments. Values were normalized to GAPDH levels in the same experiments. Error bars, SEM. Asterisks indicate P = 0.03, P = 0.01, and P = 0.01, respectively; one-sided Student’s t-test.


