
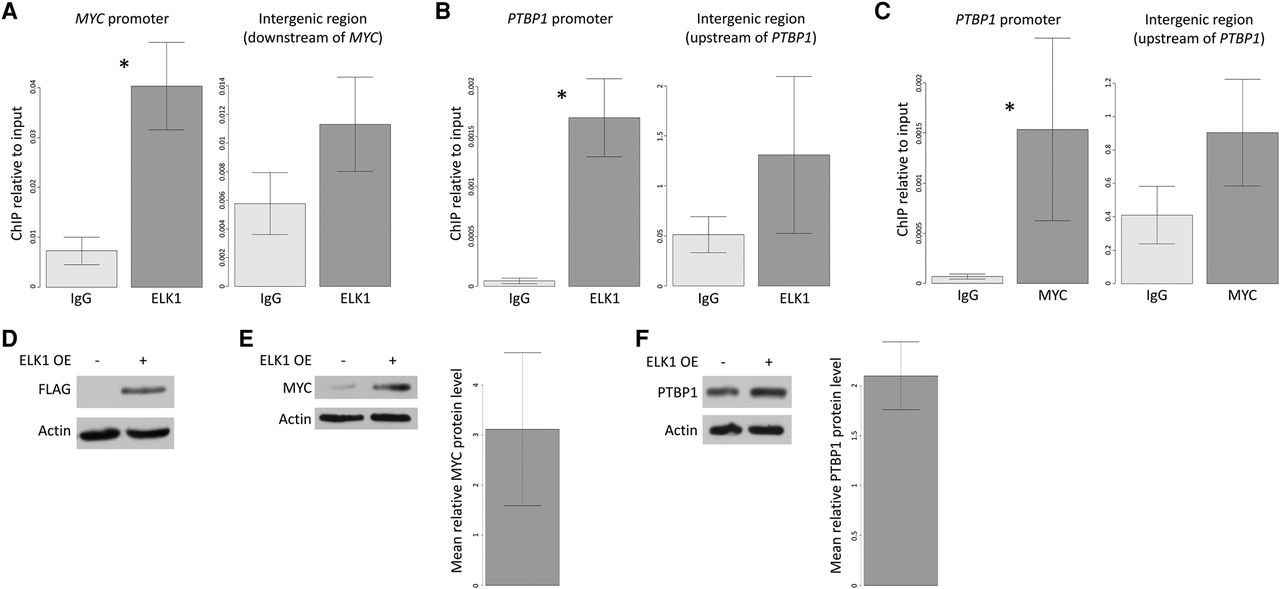
ELK1 activates a regulatory pathway that involves MYC and PTBP1. (A–C) HCT116 cells were subjected to ChIP with antibodies against ELK1 (A,B) or MYC (C). Immunoprecipitated DNA was quantified by qPCR with primers specific to the MYC (A) and PTBP1 (B,C) promoter regions as well as intergenic regions used as negative controls (Supplemental Methods). Bars, mean values of four (A,B) or five (C) independent experiments normalized to input (Supplemental Methods). Error bars, SEM. Asterisks indicate P = 0.002, P = 0.001, and P = 0.004, respectively; one-sided Student’s t-test. (D–F) HCT116 cells were transfected with a plasmid containing cDNA encoding ELK1 (ELK1 OE) or an empty vector in three independent experiments. Cell extracts were subjected to Western blot analysis with the indicated antibodies. Relative protein levels were quantified using ImageJ (Schneider et al. 2012). Error bars, SEM.


