
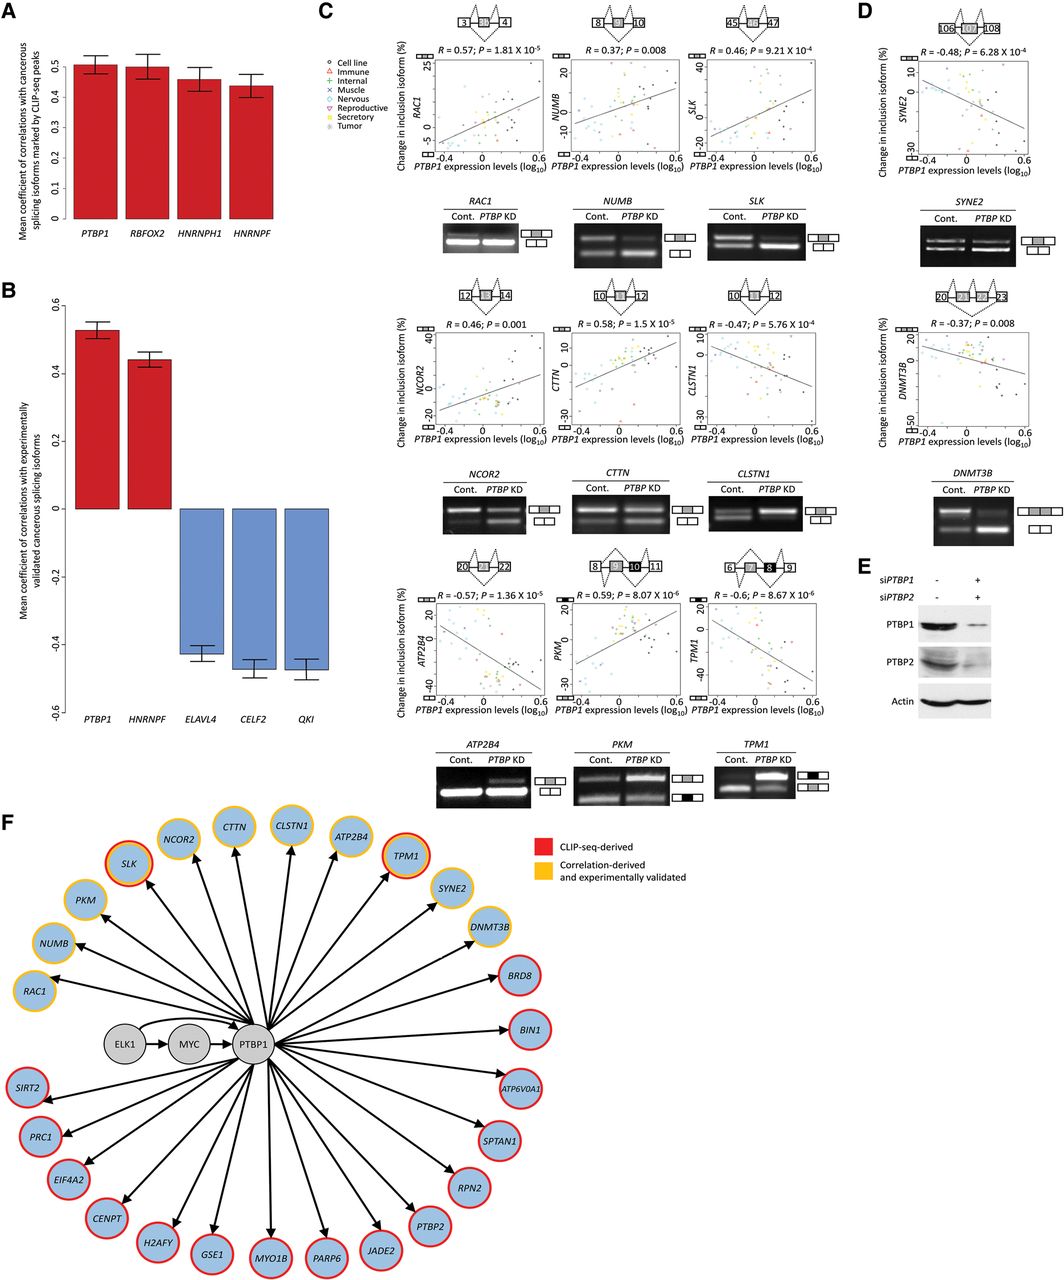
PTBP1 promotes colon tumorigenesis-triggering splicing isoforms. (A) Mean Pearson coefficients of ELK1 subnetwork alternative splicing factor gene expression correlations with splicing changes of all cancerous isoforms bound by these factors. Genes displaying fewer than five statistically significant correlations were omitted. Error bars, SEM. (B) The five highest ranking mean Pearson coefficients of alternative splicing factor gene expression correlations with the splicing changes of experimentally validated cancerous splicing isoforms. Error bars, SEM. (C,D, top) Per each alternative splicing event predicted to be regulated by PTBP1, the Pearson correlation between PTBP1 gene expression and the change in inclusion splice form across 48 human tissues and cell lines is depicted. Tissue and cell line groups are represented by different symbols. Each diagram depicts exon positions and the possible transcripts arising from the alternative splicing event. (Bottom) RT-PCR analysis of the alternative splicing event in HCT116 cells treated with either control siRNA (Cont.) or siRNA directed against PTBP1 and PTBP2 (PTBP KD) is presented as well. PKM and TPM1 RT-PCR products were digested with PstI. (E) HCT116 cells were transfected with control siRNA or siRNA directed against PTBP1 (siPTBP1) and PTBP2 (siPTBP2), and later cell extracts were subjected to Western blot analysis with the indicated antibodies. (F) Pathway connecting ELK1 with genes including PTBP1-affected and PTBP1-bound exons exhibiting splicing pattern changes in the colon tumor compared with the normal colon (genes colored light blue; other proteins are colored gray). Genes including exons derived from the analysis in B and validated in C and D are marked by yellow borders. Genes including PTBP1-bound exons are marked by red borders.


