
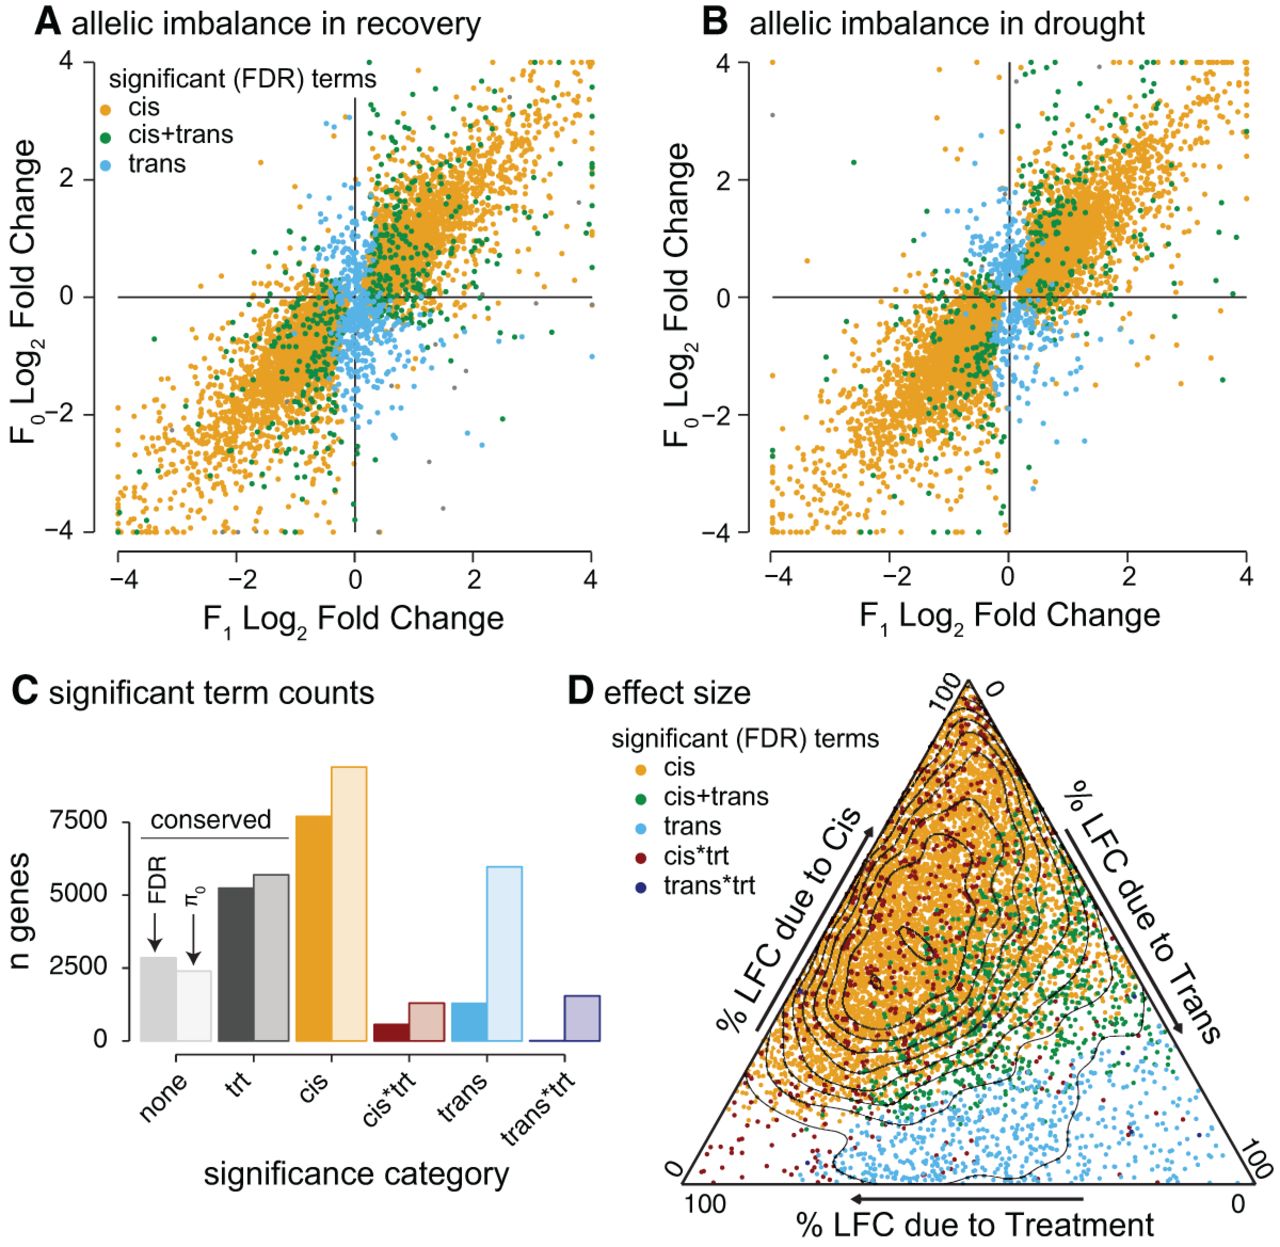
Distribution of cis, trans, and environmental interaction effects. The log2 fold change of the FIL2 vs. the HAL2 allele in the F0 and F1 generations is plotted for the recovery (A) and drought treatments (B). Coloration is derived from the significance of terms (allele—cis, allele*generation—trans). (C) All ASE genes were categorized by the model terms that caused significant differential expression. The number of genes in each bin was determined by a strict FDR threshold (left, darker bars) and the estimated number of true null hypotheses (π0, right, transparent bars) methods. Where both additive and interactive terms were significant for cis or trans (e.g., best model = y ∼ cis + cis*treatment), the model was binned into the interactive effect category. (D) For those genes with significant genetic effects (cis and/or trans), the proportions of log2 fold change due to cis, trans, and treatment are plotted in the ternary diagram. Total variance is the sum of the three components and variance attributable to interaction terms is ignored (but see Fig. 5).


