
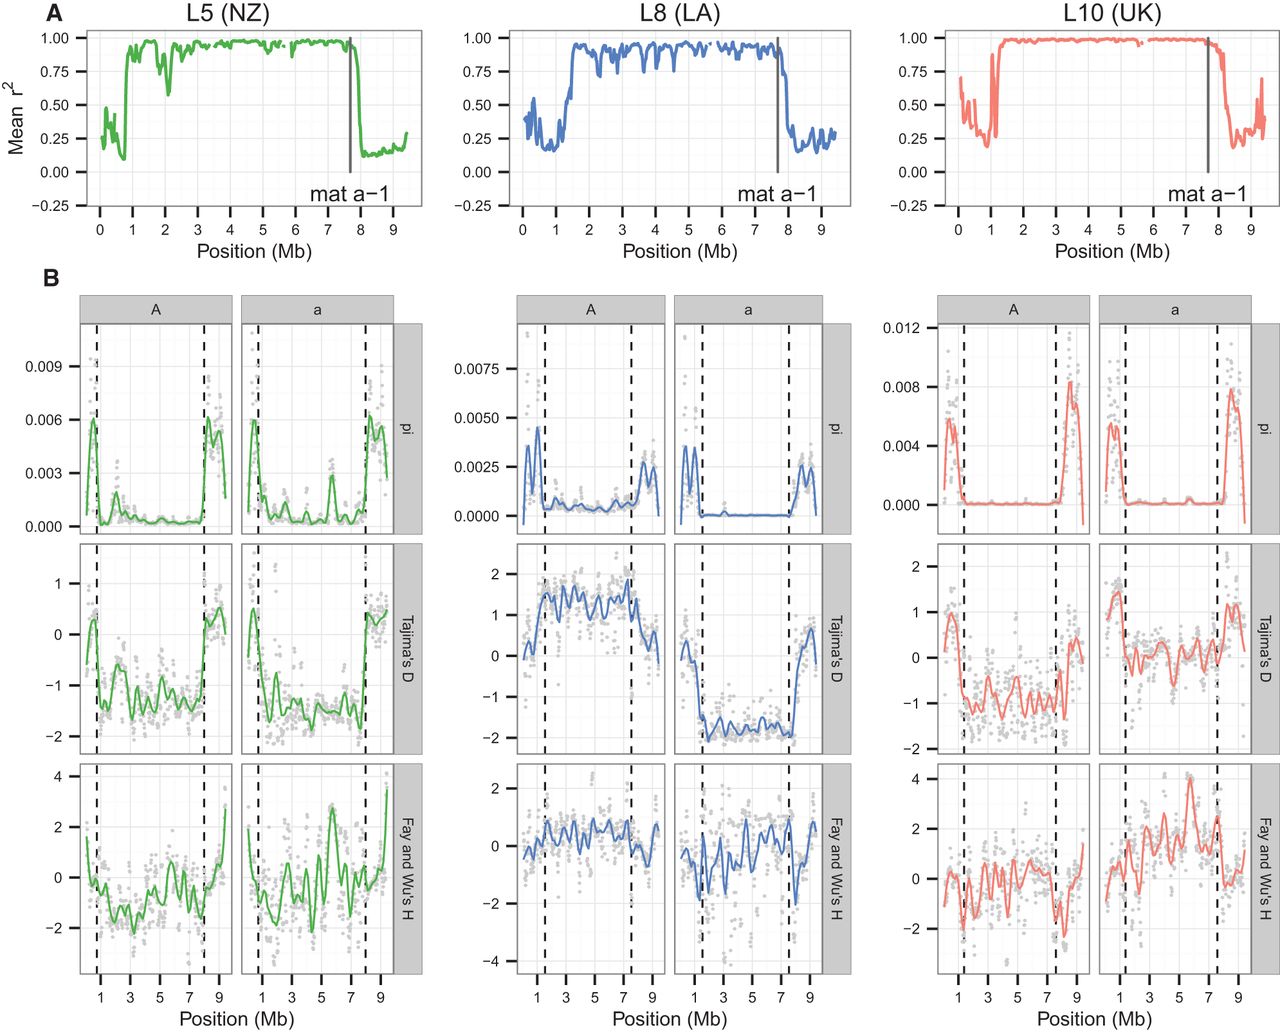
Figure 3.
Patterns of genetic variation across the mat chromosome for N. tetrasperma lineages L5, L8, and L10. (A) Linkage disequilibrium given as the mean Pearson's correlation coefficient (r2). The vertical black line shows the position of the mat a locus in the 2509 reference genome. (B) Nucleotide diversity (π), Tajima's D (Tajima 1989), and Fay and Wu's H (Fay and Wu 2000). For all variables, we used a 100-kb window size (step size 20 kb). The values for each window are represented by the gray points, and smooth lines were plotted with stat_smooth in the ggplot2 R package using the gam method with a span of 0.2. Dashed vertical lines indicate lineage-specific limits of the SR region.


