
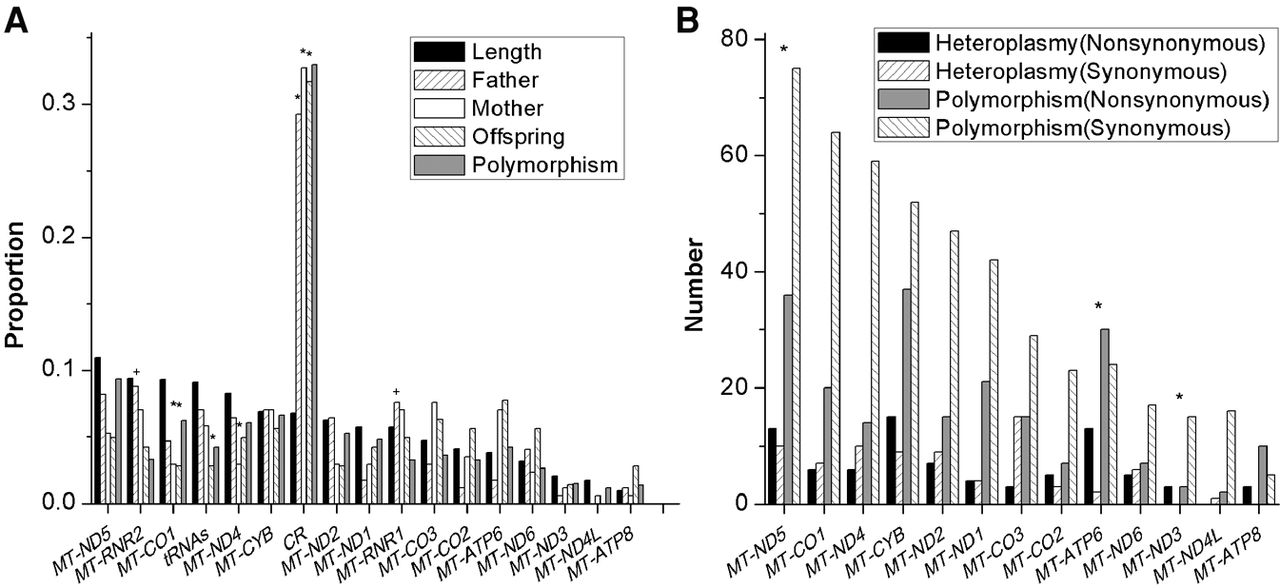
Distribution of heteroplasmies in different mtDNA gene regions. (A) Overall distribution of heteroplasmies. Black bars represent the expected heteroplasmy frequency for each gene region based purely on length. Uphill-striped, white, and downhill-striped bars represent the observed proportion of heteroplasmies identified in fathers, mothers, and offspring, respectively. Gray bars represent the polymorphism frequency for each gene region (inferred from PhyloTree Build 15 [van Oven and Kayser 2009]). Asterisks indicate significant differences (P < 0.01) between the observed and expected proportion of heteroplasmy based on gene region length, and the plus signs indicate significant differences between the observed and expected proportion of heteroplasmy based on polymorphism frequency. There were no significant differences observed between fathers and mothers, fathers and offspring, or mothers and offspring in the distribution of heteroplasmies across gene regions. (B) Number of nonsynonymous (NS) and synonymous (SS) heteroplasmies and polymorphisms observed in different genes. Asterisks indicate that the NS:SS ratio for heteroplasmies is significantly greater than the NS:SS ratio for polymorphisms in the respective gene (P < 0.05).


