
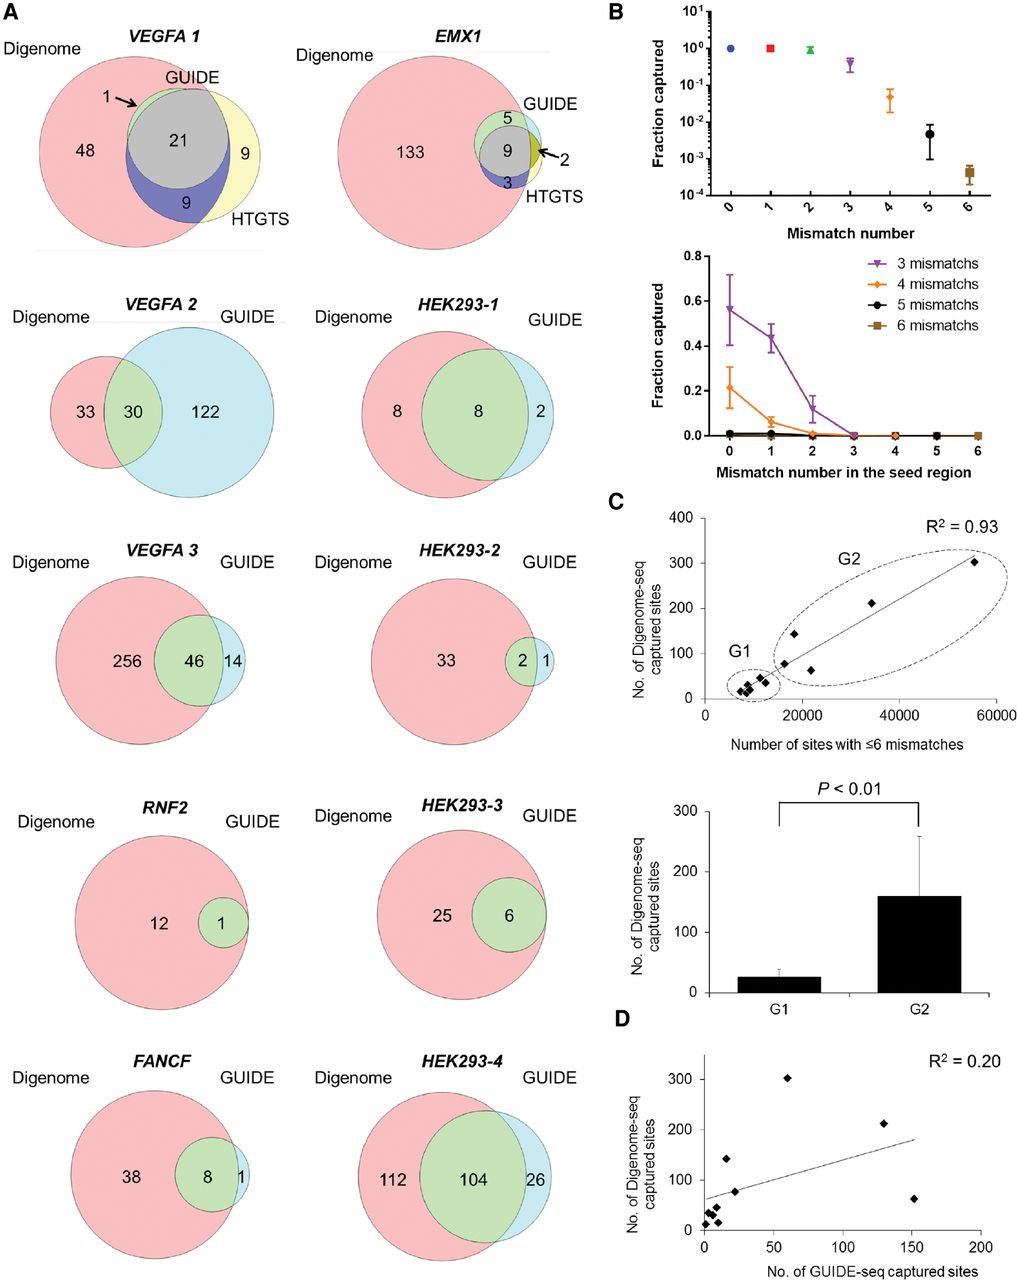
Analysis of multiplex Digenome-captured sites. (A) Venn diagrams showing the number of sites captured by Digenome-seq, GUIDE-seq, and HTGTS. (B) Fractions of sites captured by Digenome-seq according to the total mismatch number (top) and the mismatch number in the seed region (bottom). (C, top) Scatterplot of the number of sites with six or fewer mismatches in the human genome versus the number of Digenome-captured sites. (Bottom) Eleven RGEN target sites were divided into two groups, G1 and G2 (those with fewer than 13,000 and 16,000 sites, respectively, harboring six or fewer mismatches in the human genome). Error bars, SEM. The P-value was calculated by Student's t-test. (D) Scatterplot of the number of GUIDE-seq captured sites versus the number of Digenome-seq captured sites.


