
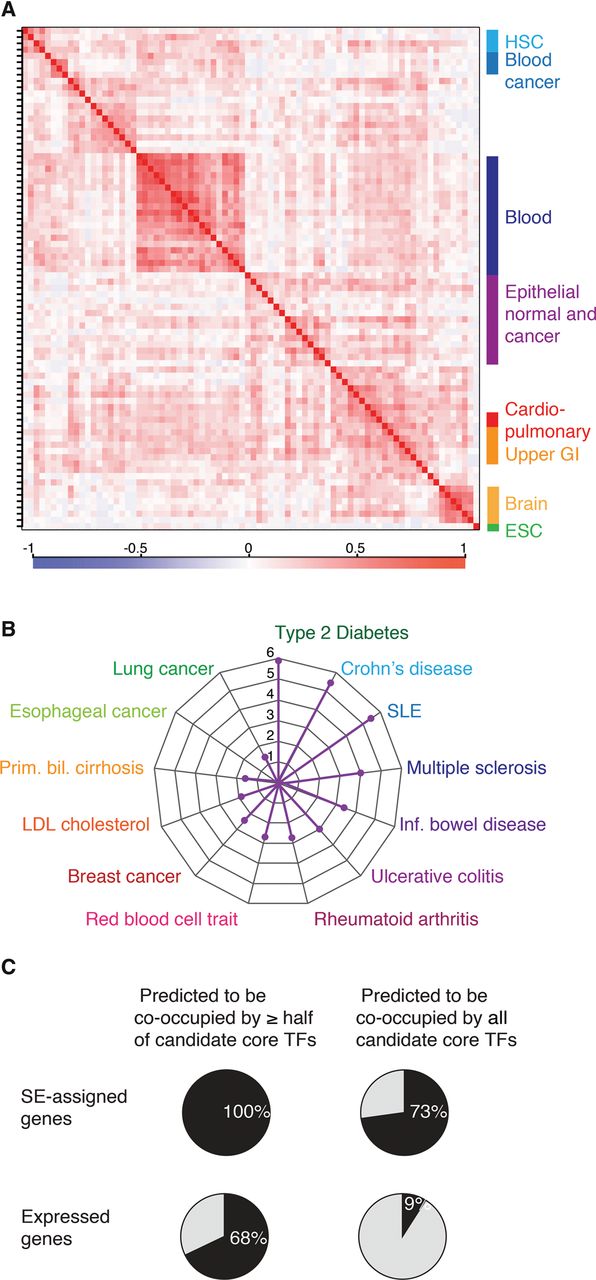
Properties of CRCs of multiple human cell and tissue types. (A) CRCs cluster according to cell type similarity. Hierarchical clustering of candidate core TFs for 80 human samples. The matrix of correlation based on Pearson coefficients identifies specific clusters for hematopoietic stem cells (HSC), blood cancer cells, blood cells, epithelial normal and cancer cells, cardio-pulmonary system cells, upper gastrointestinal system, and brain cells. Correlation values range from −1 to 1 and are colored from blue to red according to the color scale. (B) Radar plot showing the enrichment of candidate core TFs, compared to noncore TFs, in GWAS list of genes for multiple diseases or traits. P-values were calculated using a z-test, and 1/P-values are plotted for the diseases or traits that showed an enrichment P-value <5 × 10⁻² of candidate core TFs. (C) Pie charts showing the average percentages for all samples of SE-assigned genes (top row) or of all expressed genes (bottom row) whose regulatory sequences are predicted to be co-occupied by more than half or by all the TFs in the CRC.


