
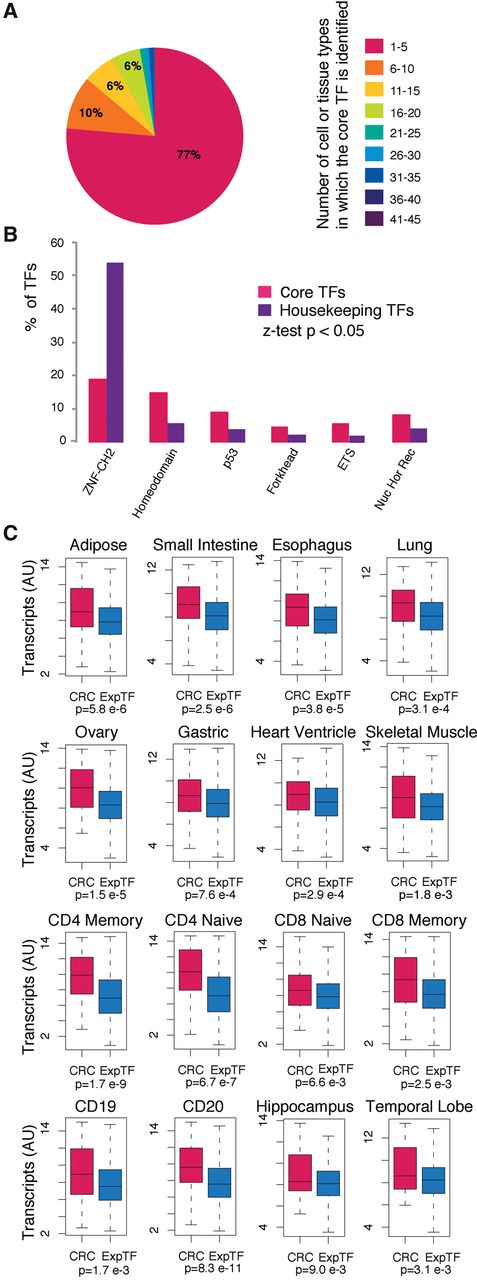
Features of candidate core TFs. (A) Percentages of TFs identified as candidate core TFs in a given number of cell or tissue types. The number of cell or tissue types in which a TF is identified as a candidate core TF is displayed with boxes on the right. A representative sample of each cell and tissue type is used when multiple samples from the same cell or tissue type are present in the data set. (B) DNA-binding domains that are significantly differentially represented in the set of candidate core TFs and housekeeping TFs. (C) Transcript levels for the set of candidate core TFs and for the full set of TFs considered expressed in each sample. P-values quantifying the difference between the two sets were calculated using a Wilcoxon test.


