
Figure 4.
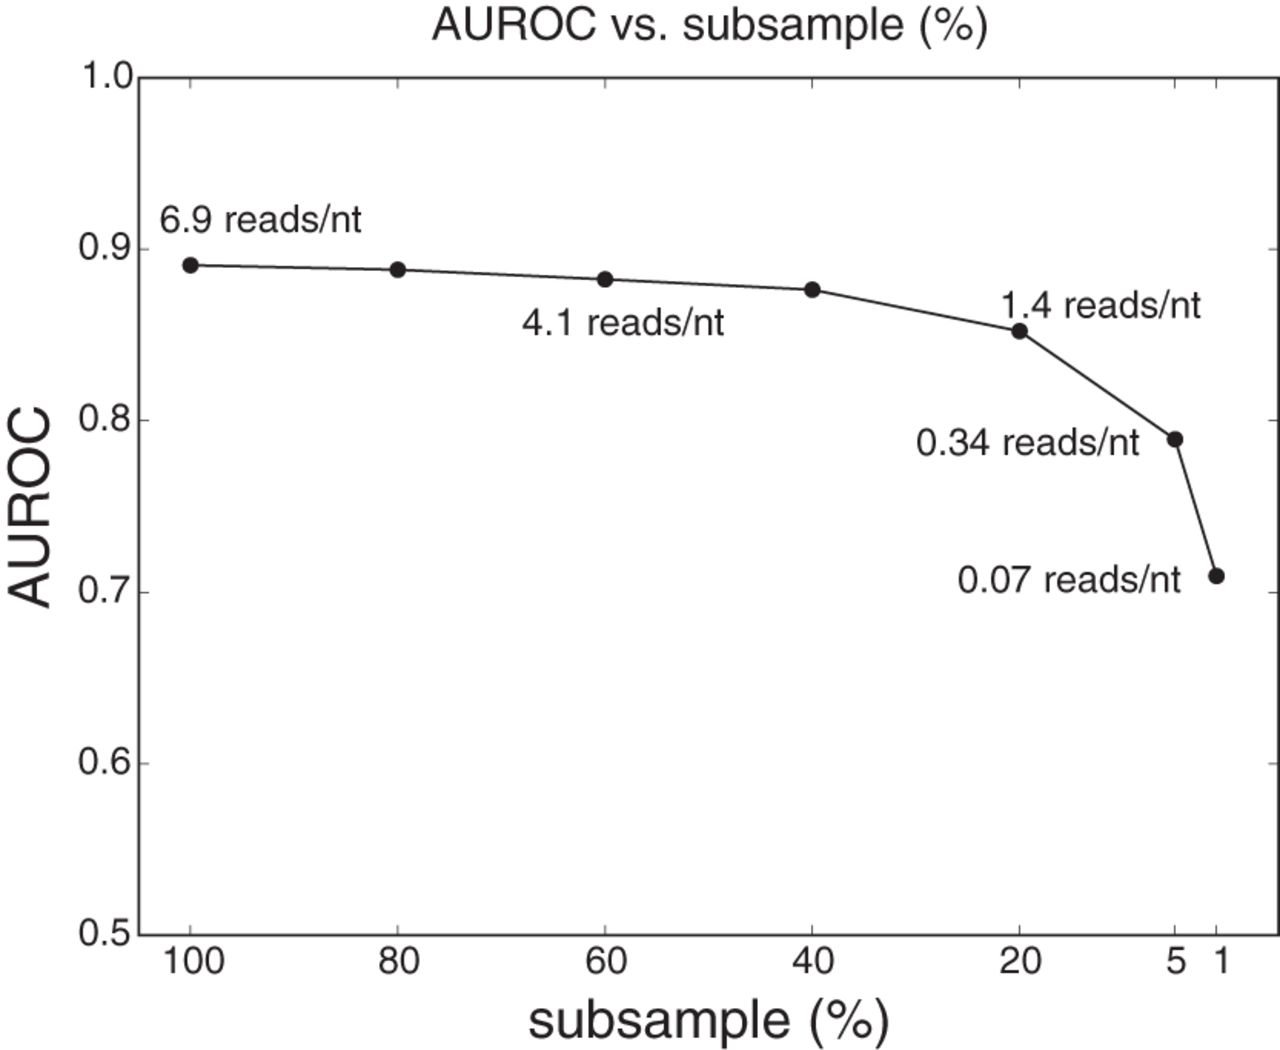
Classification performance (AUROC) as a function of data subsampling percentage. Sequencing depths (measured in reads/nt) corresponding to the subsample percentages are displayed next to the curve.
(Downloading may take up to 30 seconds. If the slide opens in your browser, select File -> Save As to save it.)
Click on image to view larger version.
Classification performance (AUROC) as a function of data subsampling percentage. Sequencing depths (measured in reads/nt) corresponding to the subsample percentages are displayed next to the curve.
 CiteULike
 Delicious
 Digg
Digg Facebook
 Google+
 Reddit
 Twitter
