
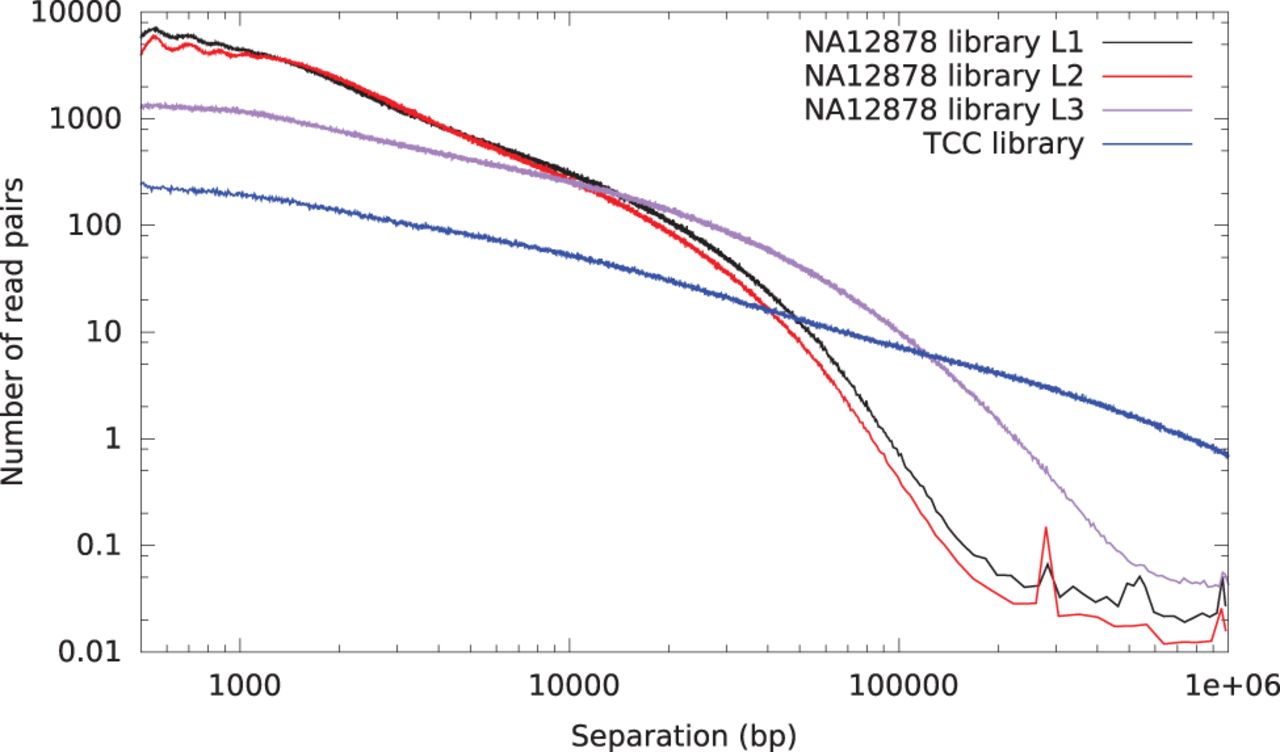
Figure 2.
Histogram of read pair separations for several sequencing libraries mapped to hg19. (Black) Chicago library L1, prepared with MboI and 150-kbp input DNA; (red) Chicago library L2, prepared with MluCI and 150-kbp input DNA; and (violet) Chicago library L3, prepared with 500-kbp input DNA. A human Hi-C library (Kalhor et al. 2012) is shown in dark blue for comparison.


