
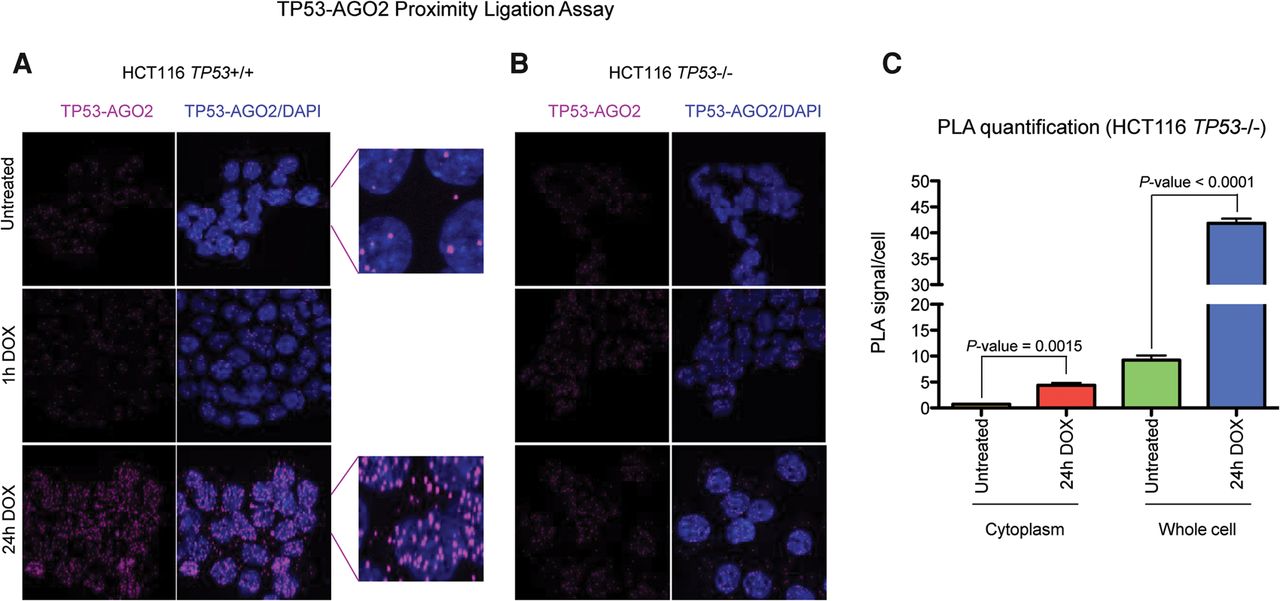
DNA damage increases the interaction between TP53 and AGO2 both in the cytoplasm and in the nucleus. (A) TP53-AGO2 PLA in HCT116 TP53+/+ cells shows that TP53 interacts with AGO2 after 24 h of DOX treatment, and this interaction also occurs in the cytoplasm but is predominantly observed in the nucleus. (B) Absence of green spots over background level in TP53−/− HCT116 cells indicates that the interaction shown by the PLA in wild-type cells, after 24 h of DOX treatment (A) is specific. (C) Bar plot showing quantification of PLA spots in the cytoplasm and in the whole HCT116 wild-type cells. Slides were imaged using a Leica TCS SP5 confocal laser-scanning microscope and analyzed using ImageJ software. The number of PLA foci was manually counted in a blind fashion (100 cells per each condition in each of three independent experiments). Cytoplasmic foci were defined as fluorescent spots that did not colocalize with the nuclei stained with DAPI (two-tailed Student's t-test). At least three independent experiments have been performed in all cases.


