
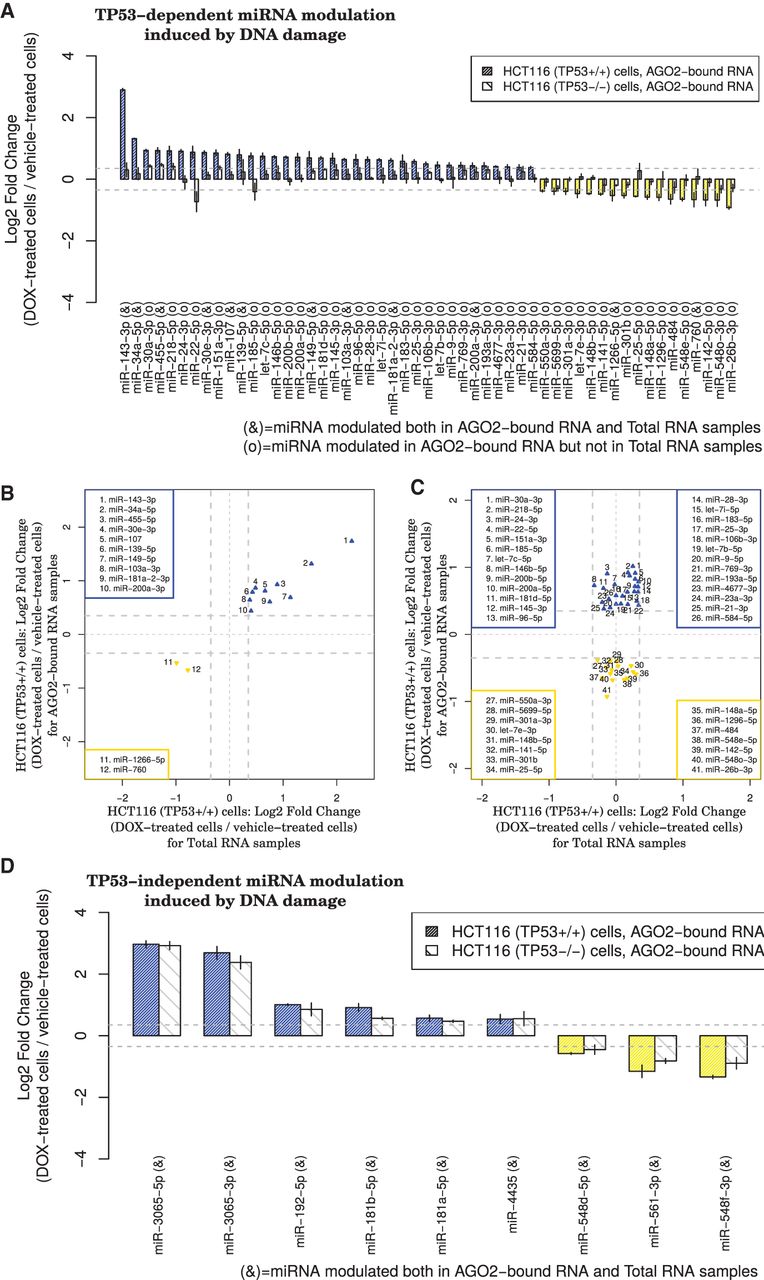
TP53 is required for DNA damage–induced modulation of the association between AGO2 and a subset of miRNAs. (A) Bar plot of fold changes for 53 miRNAs exhibiting statistically significant (Benjamini-Hochberg adjusted Student's t-test P-value < 0.05) differential expression of small RNAs isolated from immunoprecipitated AGO2 after DOX treatment. In some cases (12/53 miRNAs marked by an “&” symbol in the bar plot x-axis labels), the observed changes in levels of AGO2 binding reflect changes in abundance in total RNA induced by the treatment. In other cases (41/53 miRNAs marked by an “o” symbol in the bar plot x-axis labels), however, the observed changes in AGO2 binding occur in the absence of changes in abundance in total RNA. (B) Scatterplot showing miRNAs that change significantly in both the AGO2-immunoprecipitation and total RNA samples (HCT116 TP53+/+ cells). (C) Scatterplot showing miRNAs that significantly change in the AGO2-immunoprecipitation but not in the total RNA samples (HCT116 TP53+/+ cells). (D) Bar plot of fold changes for nine miRNAs exhibiting statistically significant (Benjamini-Hochberg adjusted Student's t-test P-value < 0.05) and TP53-independent changes in expression. For these miRNAs, changes in AGO2 binding reflect changes in abundance in total RNA (9/9 miRNAs marked by an “&” symbol in the bar plot x-axis labels). In A and D, each bar represents the mean and standard deviation of three biological replicates. In B and C, thicker dotted gray lines indicate the selected log-fold change cutoff (0.35), and thinner dotted gray lines indicate a log-fold change equal to 0.


