
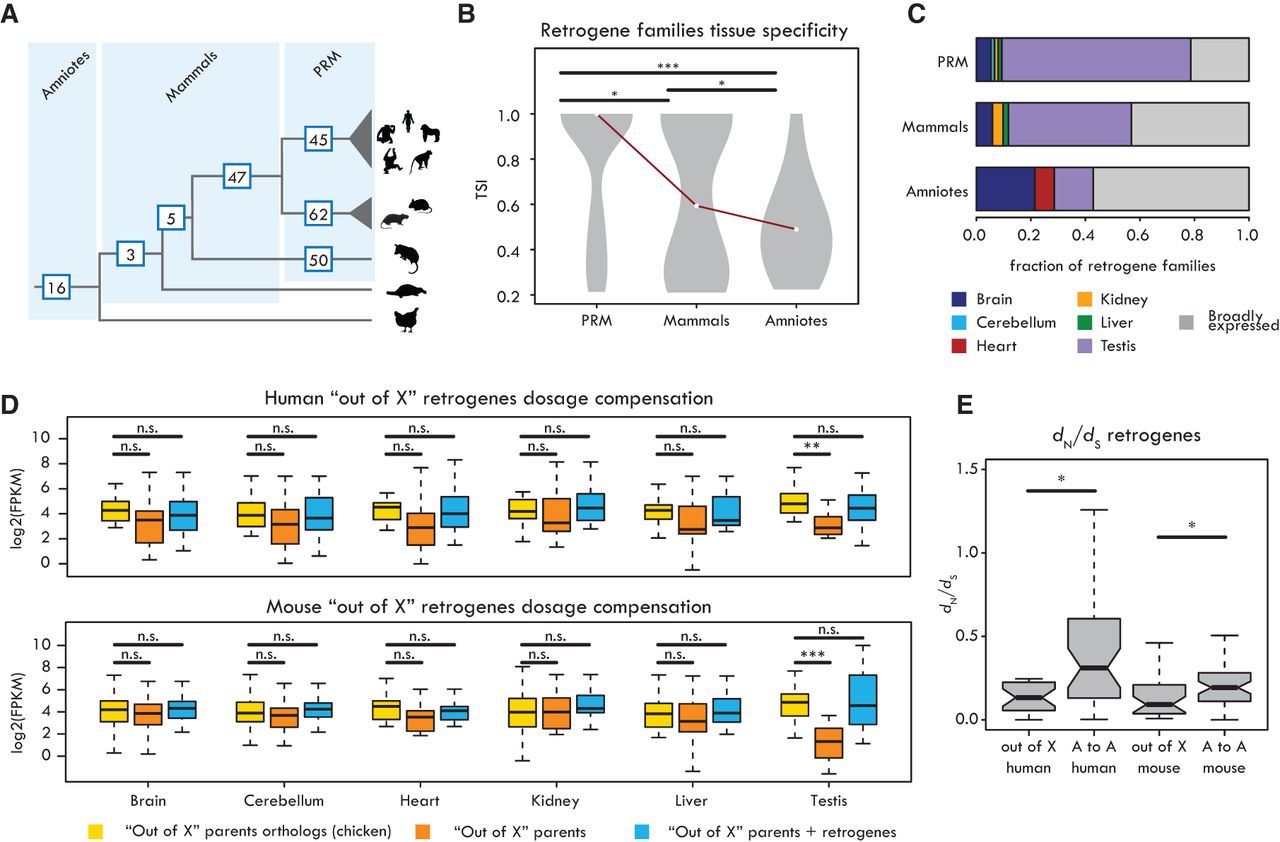
“Out of testis” and “out of X” patterns. (A) Number of retrogene families specific of each clade indicated on the respective branch. (PRM) Retrogenes specific to primates (excluding great ape–specific ones), rodents, or marsupials. (B) Tissue specificity index (TSI) distribution of retrogene families (median TSI of each family) from different evolutionary age categories. Significant differences (Kolmogorov-Smirnov test with Benjamini-Hochberg correction): (***) P < 0.001; (*) P < 0.05. (C) Proportions of retrogenes with tissue-specific (TSI ≥ 0.5) or broad (TSI < 0.5) expression for different age categories. (D) Expression levels of chicken orthologs of parental genes of “out of X” retrogenes (yellow), “out of X” parental genes (orange), and combined expression of “out of X” retrogenes and parental genes (blue) in human (19 retrogenes) and mouse (23 retrogenes). Retrogenes compensate for the significant decrease in parental gene expression only in testis. Significant differences (Wilcoxon signed-rank test with Benjamini-Hochberg correction): (***) P < 0.001; (**) P < 0.01; (n.s.) P > 0.05. (E) dN/dS ratios between “out of X” and “autosome to autosome” (“A to A”) retrogenes in human and mouse. Significant differences (Mann-Whitney U test with Benjamini-Hochberg correction): (*) P < 0.05. Whiskers up to 1.5 times the interquartile range; outliers are removed for graphical purposes.


