
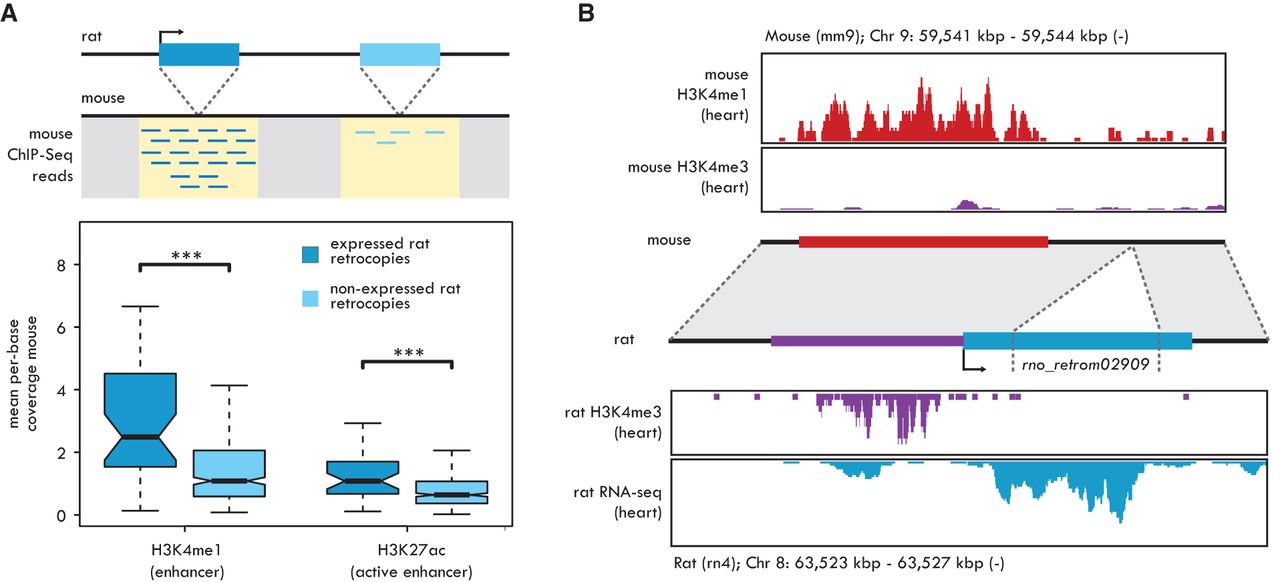
Enhancer-derived retrocopy promoters. (A, top) The integration loci of rat-specific robustly expressed (dark blue box) and not expressed (light blue box) retrocopies are mapped on the mouse genome (dotted lines). Mouse ChIP-seq reads are extracted from the regions surrounding the orthologous integration sites, indicated in yellow. (Bottom) Mouse H3K4me1 and H3K27ac mean per-base ChIP-seq coverage measured at the orthologous integration sites of rat-specific retrocopies. Significant differences (Mann-Whitney U test with Benjamini-Hochberg correction): (***) P < 0.001. Whiskers up to 1.5 times the interquartile range; outliers removed for graphical purposes. (B) Co-option of the rat-specific retrocopy rno_retrom02909 promoter from an enhancer element. (Top) H3K4me1 (red) and H3K4me3 (purple) ChIP-seq profiles from mouse heart. (Middle) Representation of the rat rno_retrom02909 retrocopy locus and its syntenic mouse region. The original integration locus is indicated by dotted lines. The blue box represents the assembled transcript. The red box, indicating the heart-specific mouse enhancer, is found upstream of the integration locus of the retrocopy and corresponds to its actual promoter region, shown in purple. Both the mouse enhancer and the rat promoter regions correspond to ChIP-seq peaks defined in this study (enhancer) or obtained from Rintisch et al. (2014). (Bottom) H3K4me3 ChIP-seq (purple) and RNA-seq (blue) profiles from rat heart. H3K4me3 coverage obtained from the sample “lv-H3K4me3-BXH06-male-bio1-tech1” from Rintisch et al. (2014).


