
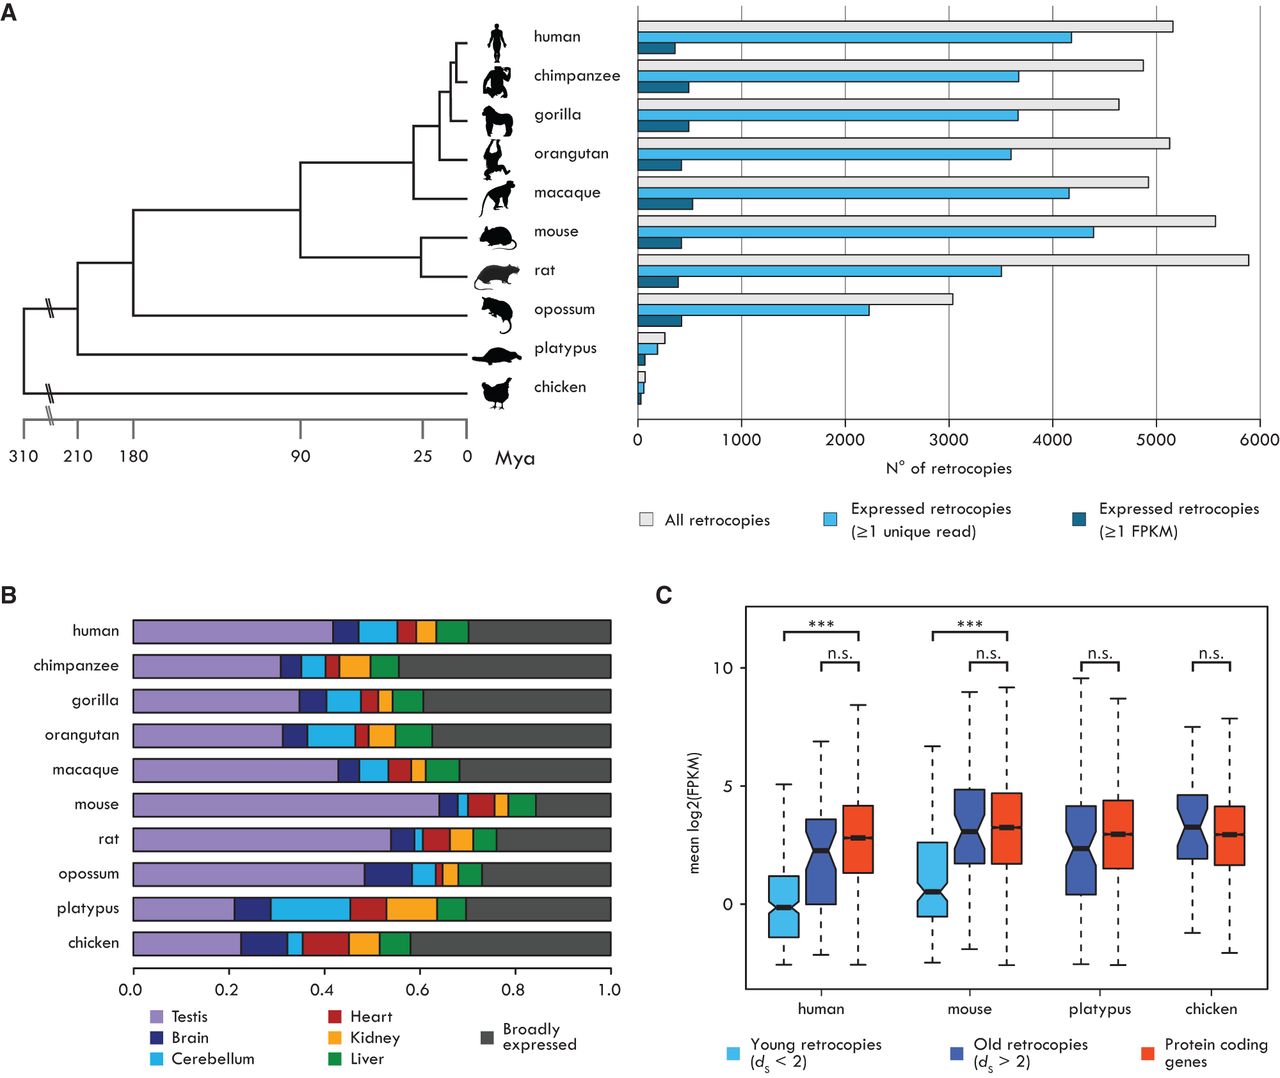
Expression profiles of mammalian retrocopies. (A, left) Phylogenetic relationships and divergence times (in million years) of the investigated species. (Right) Numbers of annotated retrocopies (gray bars), retrocopies with evidence of expression (one or more unique reads; light blue bars), and retrocopies with robust expression (≥1 FPKM; dark blue bars). (B) Proportions of robustly expressed retrocopies with tissue-specific (TSI ≥ 0.4) or broad (TSI < 0.4) expression. (C) Mean expression levels across six organs for robustly expressed retrocopies and annotated protein-coding genes. Human and mouse retrocopies were subdivided into two age classes based on their dS. As most platypus and chicken retrocopies have high dS values, no age distinction was performed. Significant differences (Mann-Whitney U test with Benjamini-Hochberg correction): (***) P < 0.001; (n.s.) P > 0.05. Whiskers up to 1.5 times the interquartile range; outliers removed for graphical purposes.


