
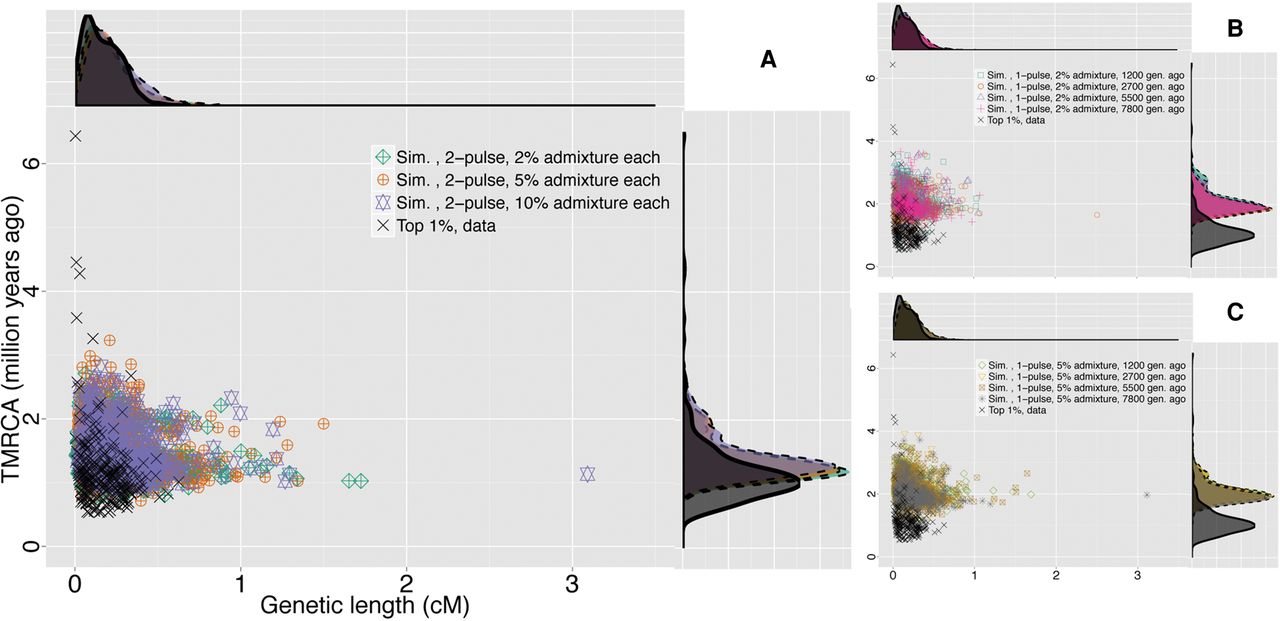
Comparison of the joint distributions of TMRCA and genetic length for the top 1% S* P-value candidate loci from the data and whole-genome archaic admixture simulations. In each panel, the joint and marginal distributions of TMRCA (million yr ago) and genetic length (cM) of our candidate loci from the data (black cross and solid line in scatter and density plots, respectively) are compared with those from archaic admixture simulations (symbols and dashed lines in scatter and density plots, respectively): (A) two-wave archaic admixture model; (B) single-wave, 2% archaic admixture; (C) single-wave, 5% archaic admixture. TMRCA estimates for archaic simulation candidates were obtained from simulated coalescent trees in MaCS (Chen et al. 2009).


