
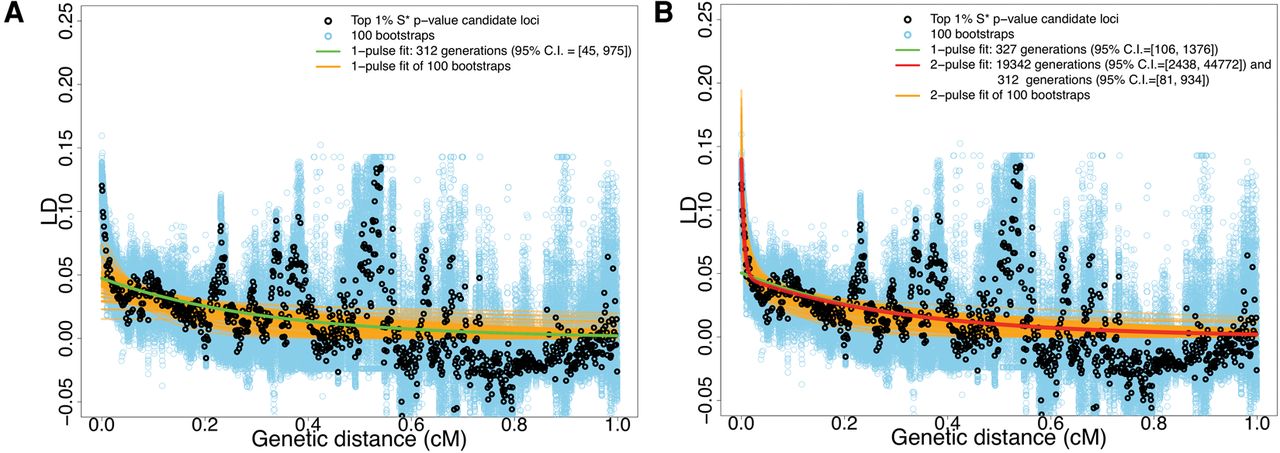
Decay of pairwise LD with respect to genetic distance for SNPs ascertained from the top 1% candidate introgressive loci. Black and blue dots are the average estimated LD among pairs of SNPs binned using genetic distance (in 0.001 cM increments) using real data and 100 bootstraps, respectively. The genetic distance is calculated based on the HapMap Yoruba map (The International HapMap Consortium 2007). For the cases of using the African American map (Hinch et al. 2011), see Supplemental Figure S10. The green curve is the fit of a single exponential using the data, while the red and orange curves are the fits of two exponentials using the real data and 100 bootstraps, respectively. (A) Fitting LD decay within genetic distance 0.02–1 cM. (B) Fitting LD decay within genetic distance 0.002–1 cM.


