
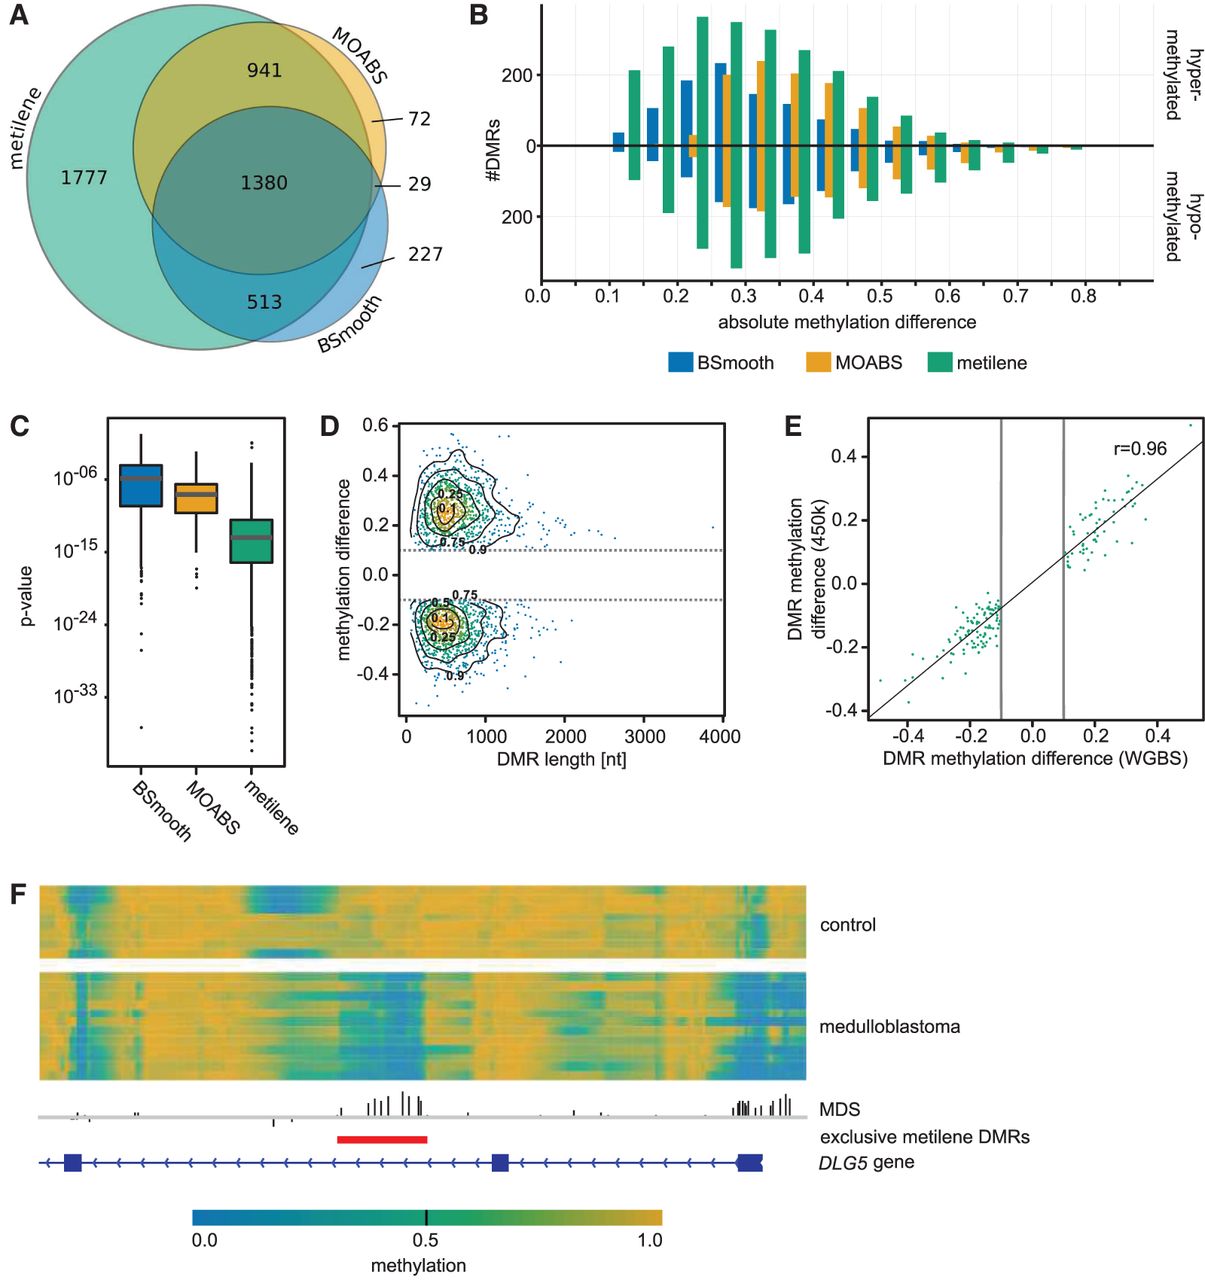
(A) Venn diagram of DMRs found by metilene, BSmooth, and MOABS in the WGBS medulloblastoma data on human Chromosome 10. (B) Count of DMRs exclusively found by metilene, BSmooth, and MOABS binned into methylation difference classes. (C) Box plots of P-values of exclusive DMRs using an independent Wilcoxon test. (D) Scatter plot of length and mean methylation differences of DMRs exclusively reported by metilene. Isoclines indicate their distribution, while labels denote the fraction of DMRs found inside the respective area. Note the minimum methylation cutoff at 0.1 (gray line). (E) Correlation of mean difference of exclusive metilene DMRs and 450k methylation beta values. The plot shows all DMRs covered by at least two probes on the array. (F) Figure of the DLG5 gene containing a DMR (red line) exclusively found by metilene. Methylation rates of control (top) and medulloblastoma (below) are heatmap color-coded, indicating low methylation rates in blue and high methylation rates in yellow. The MDS is shown above the DMR annotation and the gene annotation (bottom).


