
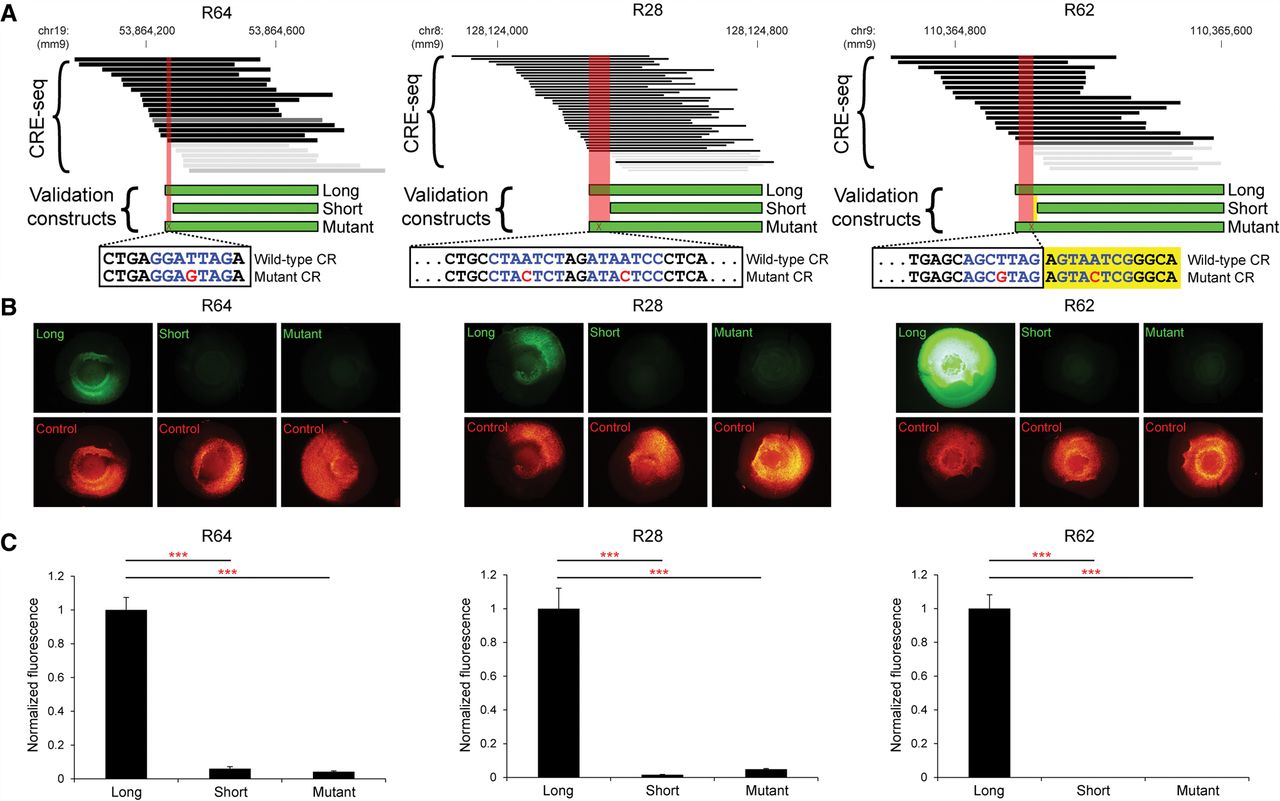
Validation of individual loci by fluorescence reporter assays. (A) Critical regions (red areas) identified by CRE-seq truncation mutation analysis at three retinal DHSs (R64, R28, and R62) were validated by testing of individual constructs with fluorescence reporter assays. Depicted CRE-seq data are based on expression scores averaged across retinal replicates. Note that R64 is the same locus as in Figure 6B. For each locus, a “long” construct containing the critical region (CR), a “short” construct without the critical region, and a “mutant” construct with point mutations (red font) in predicted CRX sites (blue font) were synthesized. Sequences are shown for the plus strand of DNA in all cases. For R62, one CRX site fell within the critical region, and a second CRX site was immediately adjacent (yellow area). Individual test constructs were directionally cloned upstream of the minimal promoter-GFP cassette in a non-AAV vector. The test constructs were coelectroporated into explant retinas with Rho-CBR3-DsRed (Corbo et al. 2010) as a loading control. (B) Representative whole-mount images of electroporated retinas are shown (exposure times are the same for all images). (C) Quantification of the GFP levels normalized to DsRed levels. Error bars represent SEM (n = 10–12 retinas per test construct). (***) P-value <10−6 (two-tailed Student's t-test).


