
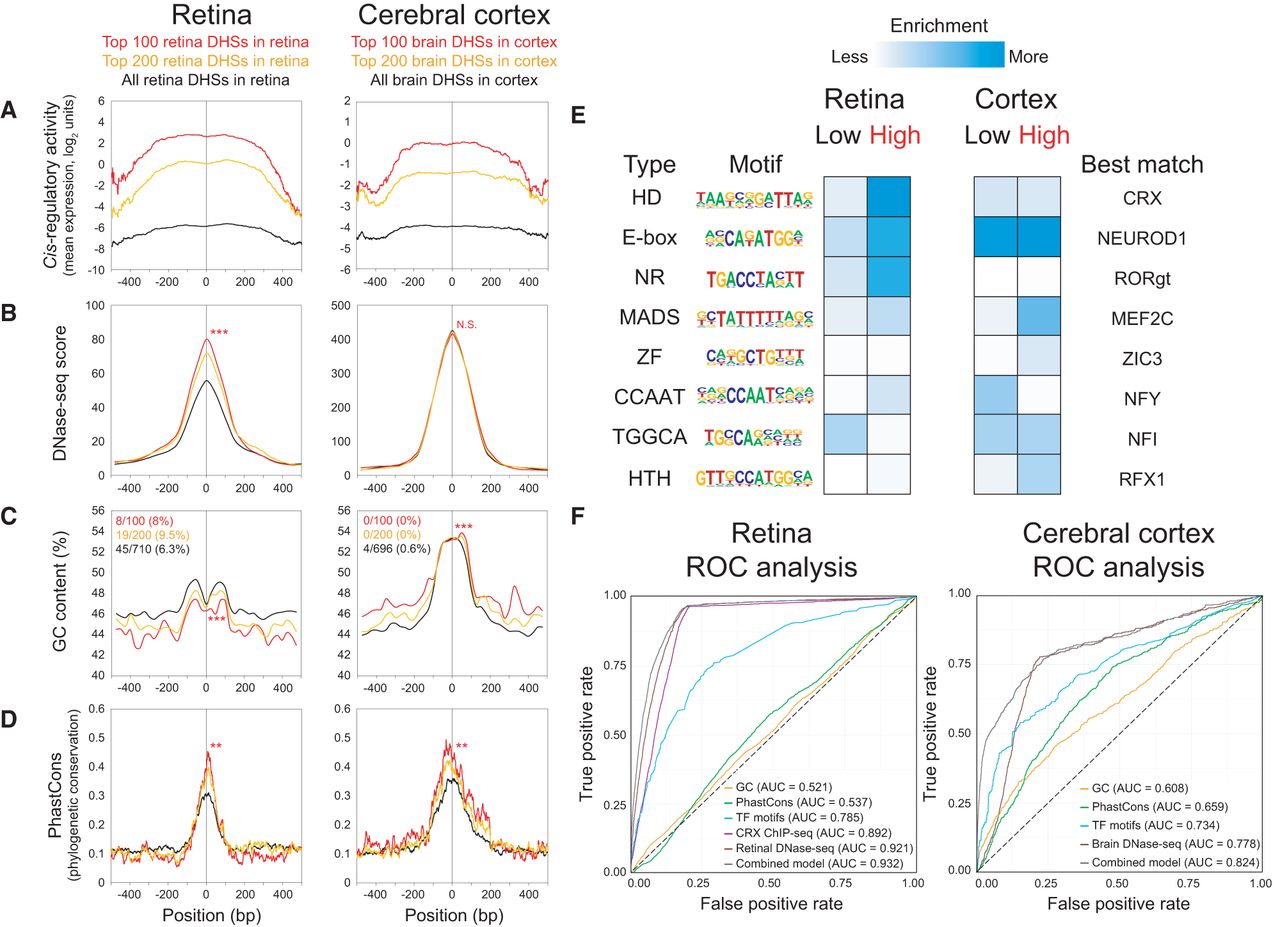
Parameters that predict CRE activity. (A–D) Retinal DHSs as assayed in the retina (left) and brain DHSs as assayed in the cerebral cortex (right). Each panel shows a 1-kb centered window. Only DHSs with at least two barcodes were included in this analysis, i.e., 710 retinal DHSs in retina (black lines, left) and 696 brain DHSs in cortex (black lines, right). The top 100 (red lines, left) and top 200 (orange lines, left) retinal DHSs expressed in the retina and the top 100 (red lines, right) and top 200 (orange lines, right) brain DHSs expressed in the cortex are shown. To compare the top 100 DHSs versus the rest of the DHSs in each group, a two-tailed Student's t-test was calculated for the means within the 1-kb window, except for PhastCons scores, which was calculated within the central 100 bp: (**) P < 0.01; (***) P < 0.001; (N.S.) not significant. (A) Cis-regulatory activity, as measured by mean expression in log2 units. For each assayed DHS, at each base position across the 1-kb window, the expression values of the individual barcoded constructs whose CREs overlapped the position were averaged across biological replicates. (B) DNase-seq score (Yue et al. 2014). (C) GC content, calculated in 50-bp windows, sliding 25 bp at a time. The fractions denote the proportion of DHSs that were promoter-proximal (i.e., located within −1 kb to +100 bp relative to the nearest TSS) based on GREAT annotations (McLean et al. 2010). (D) Phylogenetic conservation as measured by 30-way vertebrate PhastCons (Siepel et al. 2005). (E) Enrichment for TF motifs among low- versus high-expressing DHSs in each tissue, without restriction on the type of DHS (see Methods). Only significant motifs are shown (P < 0.05 in at least one category). For motifs enriched in both tissues, the logo from the tissue with the more significant enrichment is shown: (HD) homeodomain; (NR) nuclear receptor; (ZF) zinc finger; (HTH) helix-turn-helix. (F) Receiver operator characteristic (ROC) curves show the performance of logistic regression models for GC content, PhastCons, TF motifs, retina or brain DNase-seq, or a combined model. A model based on CRX ChIP-seq (Corbo et al. 2010) was included for the retina only. The area under the curve (AUC) for each model is indicated. For cross-validation results, see Supplemental Table S6.


