
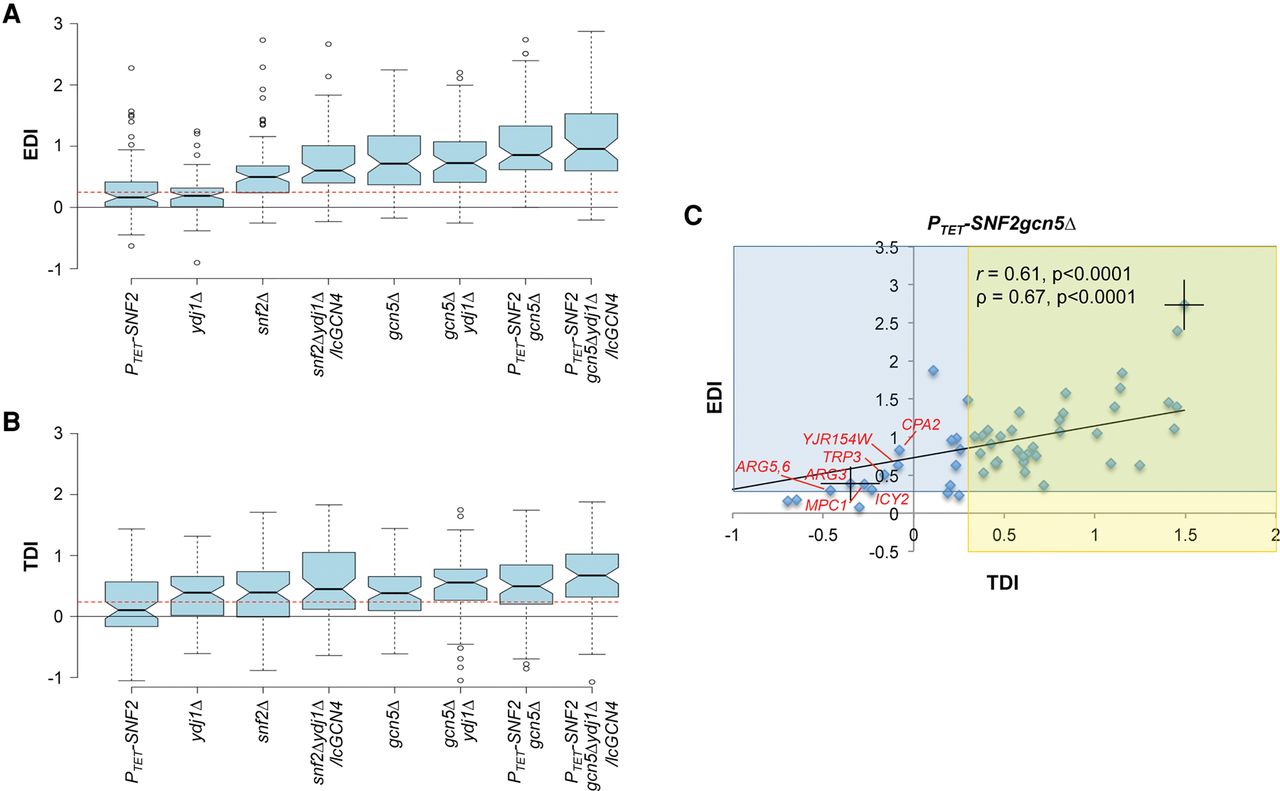
Defects in promoter H3 eviction are associated with defects in Pol II induction for 70 induced exemplar genes. (A,B) Notched-box plots of EDI and TDI values for the 70 exemplar genes in eight mutants (tabulated in Supplemental File S5, sheet 2). EDIs were calculated for each gene from H3 ChIP-seq data from three replicates as (H3I(mut) − H3I(WT))/(H3U(WT) − H3I(WT)), where H3I(mut) and H3U(WT) signify the Avg. H3 Occs. per base pair in the [−1,NDR,+1] regions in induced mutant or WTU cells, respectively. TDIs were calculated similarly for each gene as (RI(WT) − RI(mut))/(RI(WT) − RU(WT)), where R designates average Rpb3 occupancy per base pair in CDS. (C) EDI versus TDI scatterplot for 54 of the group of 70 exemplar genes in PTET-SNF2gcn5Δ cells. Mean EDI and TDI values (±SEM) were calculated for each gene by averaging the EDI or TDI values calculated from H3 or Rpb3 ChIP-seq data from each of three biological replicates (tabulated in Supplemental File S5, sheet 1), and genes with both SEM values <0.25 of the mean EDI and with SEM values <0.125 of the mean TDI values (thus excluding genes CIT2, ACO1, SDH6, LYS21, LYS20, YDR531W, ESBP6, BSC5, UGP1, YBT1, CTT1, HOR7, BAR1, STE2, BAT2, and NRG1) were subjected to correlation analyses to obtain the indicated Pearson's and Spearman's coefficients and P-values. Error bars (±SD) shown for two genes (TPO1 and ARG3) are the largest observed for any of the 54 genes. Yellow and blue zones indicate TDI or EDI values ≥0.3, respectively, and exceptional genes with EDI > 0.3/TDI < 0 are labeled red. Data for RTS3 were not plotted because its large negative EDI value would confine the majority of data points to a small portion of the x-axis.


