
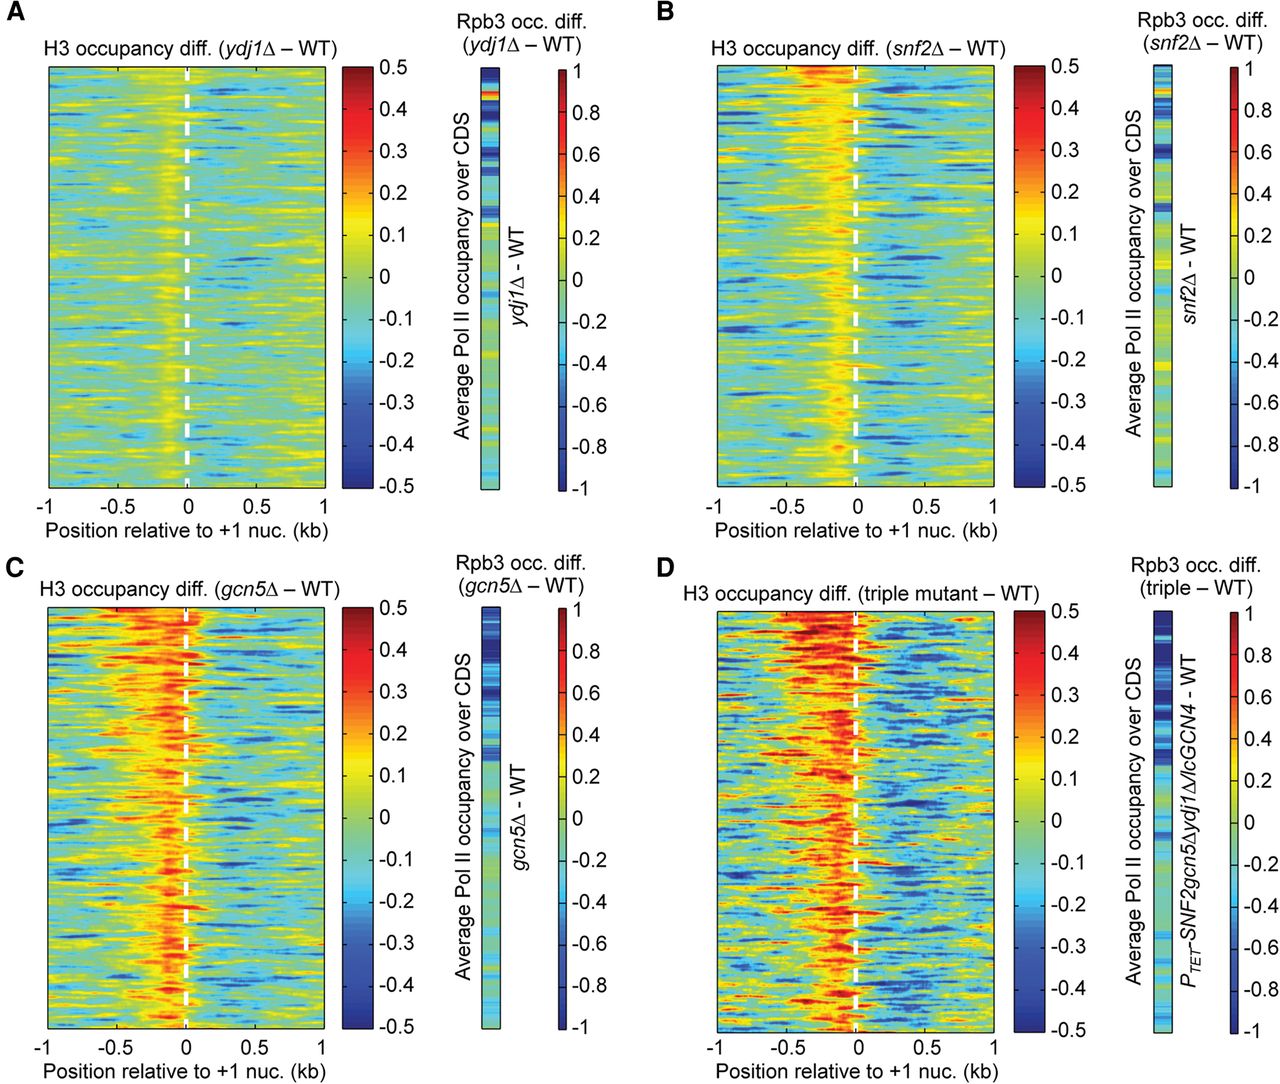
Figure 5.
Reductions in Pol II occupancy are associated with increased H3 promoter occupancy for 1000 genes with the greatest eviction of promoter nucleosomes in WT induced cells. (A–D) Heat maps for the identically ordered 1000 genes shown in Figure 2D, constructed as described there, for the indicated mutants.


