
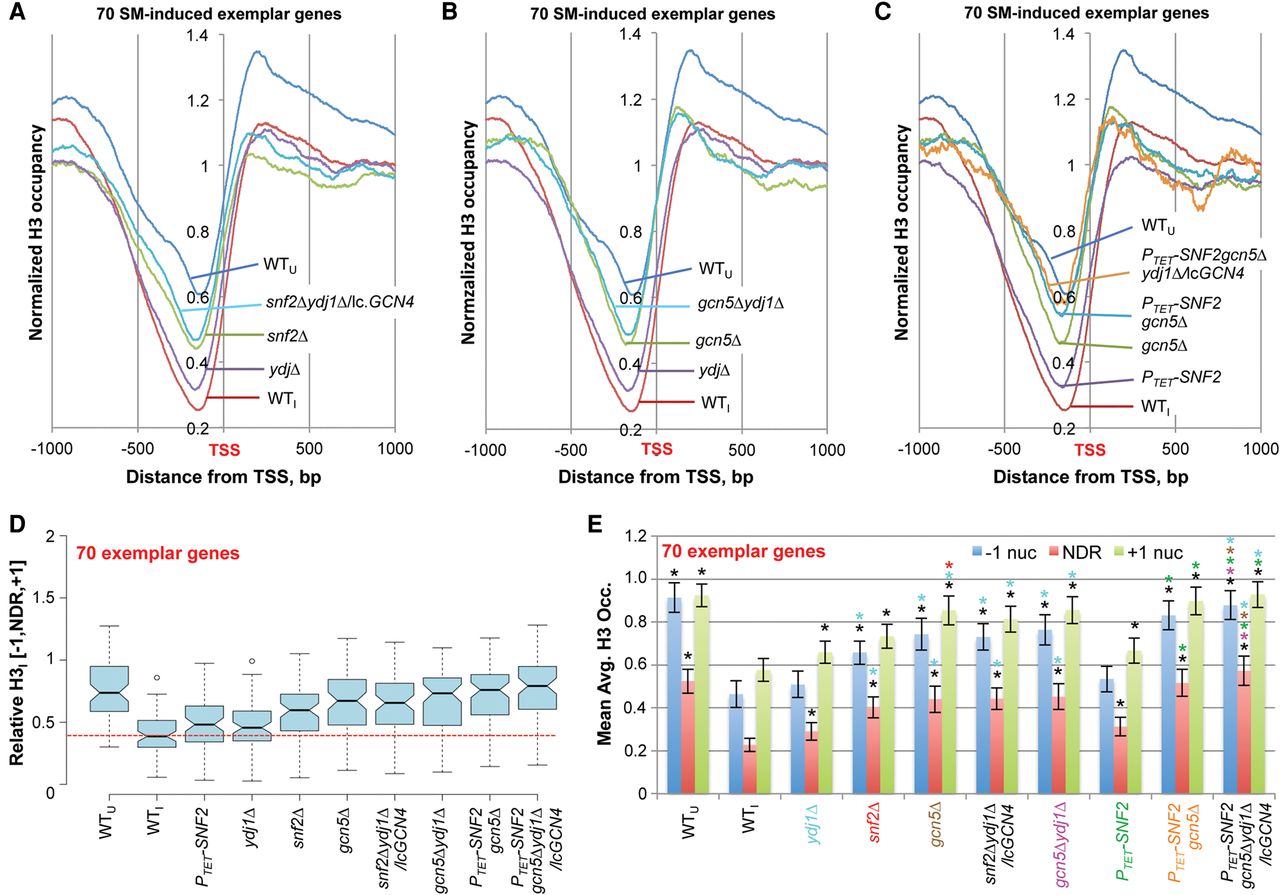
Snf2, Ydj1, and Gcn5 cooperate in H3 eviction from promoters of 70 exemplar induced genes. (A–C) TSS plots of average relative H3 occupancies calculated as in Figure 2A–C, except for only the 70 exemplar genes, for WTU, WTI, and the indicated mutants under inducing conditions. (D) Notched-box plots of average relative H3 occupancies in the [−1,NDR,+1] region for the 70 exemplar genes calculated from ChIP-seq data from three replicates for each mutant. Each box depicts the interquartile range containing 50% of the data, intersected by the median; the notch indicates a 95% confidence interval (CI) around the median. (E) Mean Avg. H3 Occ. per base pair (±95% CI) calculated for the 70 exemplar genes for the three promoter zones using the relative H3 occupancies determined by ChIP-seq analysis of three replicates. Asterisks indicating significant differences in Student's t-tests (P < 0.05) are color-coded to indicate strains being compared, e.g., red asterisk above the gcn5Δ +1 nuc bar indicates a mean significantly different than the corresponding +1 nuc mean for the snf2Δ strain (labeled red).


